
 Yahoo Finance
 Does B.P. Marsh & Partners' (LON:BPM) Share Price Gain of 81% Match Its Business Performance?
Generally speaking the aim of active stock picking is to find companies that provide returns that are superior to the market average. And in our experience, buying the right stocks can give your wealth a significant boost. For example, the B.P. Marsh & Partners PLC (LON:BPM) share price is up 81% in the last 5 years, clearly besting the market return of around 16% (ignoring dividends). However, more recent returns haven't been as impressive as that, with the stock returning just 63% in the last year , including dividends .
See our latest analysis for B.P. Marsh & Partners
To paraphrase Benjamin Graham: Over the short term the market is a voting machine, but over the long term it's a weighing machine. One flawed but reasonable way to assess how sentiment around a company has changed is to compare the earnings per share (EPS) with the share price.
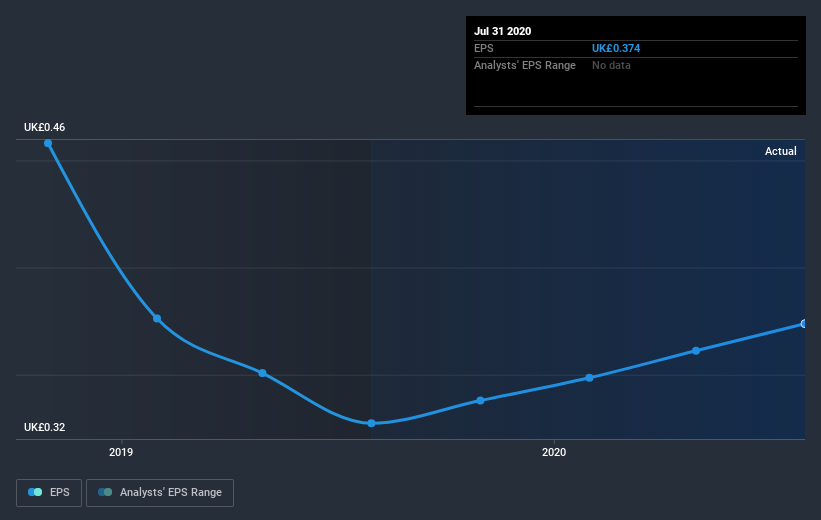
During five years of share price growth, B.P. Marsh & Partners achieved compound earnings per share (EPS) growth of 11% per year. So the EPS growth rate is rather close to the annualized share price gain of 13% per year. That suggests that the market sentiment around the company hasn't changed much over that time. Indeed, it would appear the share price is reacting to the EPS.
You can see below how EPS has changed over time (discover the exact values by clicking on the image).
Before buying or selling a stock, we always recommend a close examination of historic growth trends, available here.
What About Dividends?
It is important to consider the total shareholder return, as well as the share price return, for any given stock. Whereas the share price return only reflects the change in the share price, the TSR includes the value of dividends (assuming they were reinvested) and the benefit of any discounted capital raising or spin-off. It's fair to say that the TSR gives a more complete picture for stocks that pay a dividend. We note that for B.P. Marsh & Partners the TSR over the last 5 years was 97%, which is better than the share price return mentioned above. The dividends paid by the company have thusly boosted the total shareholder return.
A Different Perspective
We're pleased to report that B.P. Marsh & Partners shareholders have received a total shareholder return of 63% over one year. And that does include the dividend. Since the one-year TSR is better than the five-year TSR (the latter coming in at 14% per year), it would seem that the stock's performance has improved in recent times. In the best case scenario, this may hint at some real business momentum, implying that now could be a great time to delve deeper. Most investors take the time to check the data on insider transactions. You can click here to see if insiders have been buying or selling.
Of course, you might find a fantastic investment by looking elsewhere. So take a peek at this free list of companies we expect will grow earnings.
Please note, the market returns quoted in this article reflect the market weighted average returns of stocks that currently trade on GB exchanges.
This article by Simply Wall St is general in nature. It does not constitute a recommendation to buy or sell any stock, and does not take account of your objectives, or your financial situation. We aim to bring you long-term focused analysis driven by fundamental data. Note that our analysis may not factor in the latest price-sensitive company announcements or qualitative material. Simply Wall St has no position in any stocks mentioned.
Have feedback on this article? Concerned about the content? Get in touch with us directly. Alternatively, email editorial-team (at) simplywallst.com.
