
 Yahoo Finance
 What does Babcock International Group PLC's (LON:BAB) Balance Sheet Tell Us About Its Future?

Mid-caps stocks, like Babcock International Group PLC (LON:BAB) with a market capitalization of UK£2.6b, aren’t the focus of most investors who prefer to direct their investments towards either large-cap or small-cap stocks. However, generally ignored mid-caps have historically delivered better risk-adjusted returns than the two other categories of stocks. BAB’s financial liquidity and debt position will be analysed in this article, to get an idea of whether the company can fund opportunities for strategic growth and maintain strength through economic downturns. Remember this is a very top-level look that focuses exclusively on financial health, so I recommend a deeper analysis into BAB here.
Want to participate in a short research study? Help shape the future of investing tools and you could win a $250 gift card!
Check out our latest analysis for Babcock International Group
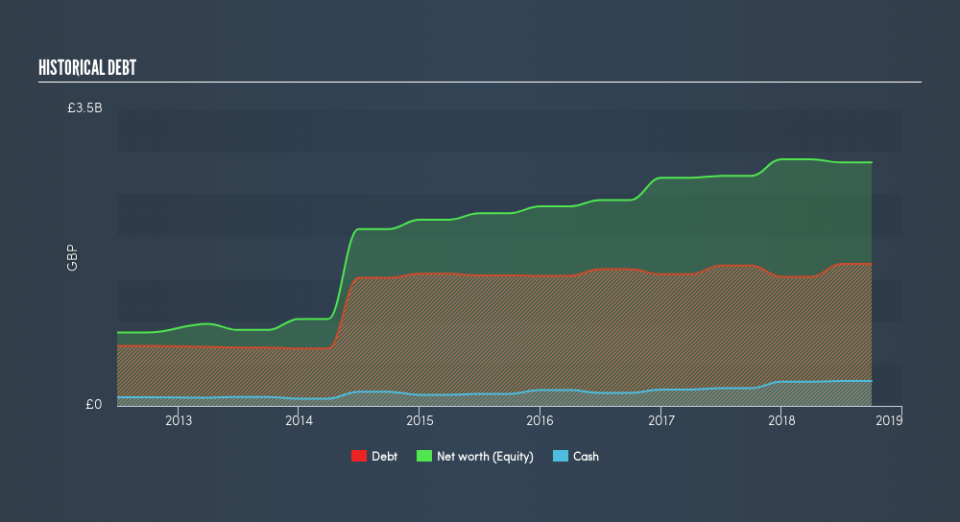
Does BAB Produce Much Cash Relative To Its Debt?
BAB's debt level has been constant at around UK£1.7b over the previous year including long-term debt. At this stable level of debt, BAB's cash and short-term investments stands at UK£293m to keep the business going. Additionally, BAB has produced UK£390m in operating cash flow in the last twelve months, leading to an operating cash to total debt ratio of 23%, meaning that BAB’s current level of operating cash is high enough to cover debt.
Can BAB pay its short-term liabilities?
With current liabilities at UK£1.5b, it appears that the company has been able to meet these commitments with a current assets level of UK£1.6b, leading to a 1.09x current account ratio. The current ratio is the number you get when you divide current assets by current liabilities. For Commercial Services companies, this ratio is within a sensible range since there's a sufficient cash cushion without leaving too much capital idle or in low-earning investments.
Can BAB service its debt comfortably?
With debt reaching 58% of equity, BAB may be thought of as relatively highly levered. This is not uncommon for a mid-cap company given that debt tends to be lower-cost and at times, more accessible. We can test if BAB’s debt levels are sustainable by measuring interest payments against earnings of a company. Ideally, earnings before interest and tax (EBIT) should cover net interest by at least three times. For BAB, the ratio of 10.99x suggests that interest is comfortably covered, which means that debtors may be willing to loan the company more money, giving BAB ample headroom to grow its debt facilities.
Next Steps:
BAB’s high cash coverage means that, although its debt levels are high, the company is able to utilise its borrowings efficiently in order to generate cash flow. Since there is also no concerns around BAB's liquidity needs, this may be its optimal capital structure for the time being. I admit this is a fairly basic analysis for BAB's financial health. Other important fundamentals need to be considered alongside. You should continue to research Babcock International Group to get a more holistic view of the mid-cap by looking at:
Future Outlook: What are well-informed industry analysts predicting for BAB’s future growth? Take a look at our free research report of analyst consensus for BAB’s outlook.
Valuation: What is BAB worth today? Is the stock undervalued, even when its growth outlook is factored into its intrinsic value? The intrinsic value infographic in our free research report helps visualize whether BAB is currently mispriced by the market.
Other High-Performing Stocks: Are there other stocks that provide better prospects with proven track records? Explore our free list of these great stocks here.
We aim to bring you long-term focused research analysis driven by fundamental data. Note that our analysis may not factor in the latest price-sensitive company announcements or qualitative material.
If you spot an error that warrants correction, please contact the editor at editorial-team@simplywallst.com. This article by Simply Wall St is general in nature. It does not constitute a recommendation to buy or sell any stock, and does not take account of your objectives, or your financial situation. Simply Wall St has no position in the stocks mentioned. Thank you for reading.
