
 Yahoo Finance
 What Does Balfour Beatty plc's (LON:BBY) Balance Sheet Tell Us About It?

While small-cap stocks, such as Balfour Beatty plc (LON:BBY) with its market cap of UK£1.5b, are popular for their explosive growth, investors should also be aware of their balance sheet to judge whether the company can survive a downturn. Evaluating financial health as part of your investment thesis is vital, since poor capital management may bring about bankruptcies, which occur at a higher rate for small-caps. Let's work through some financial health checks you may wish to consider if you're interested in this stock. Nevertheless, this is just a partial view of the stock, and I recommend you dig deeper yourself into BBY here.
BBY’s Debt (And Cash Flows)
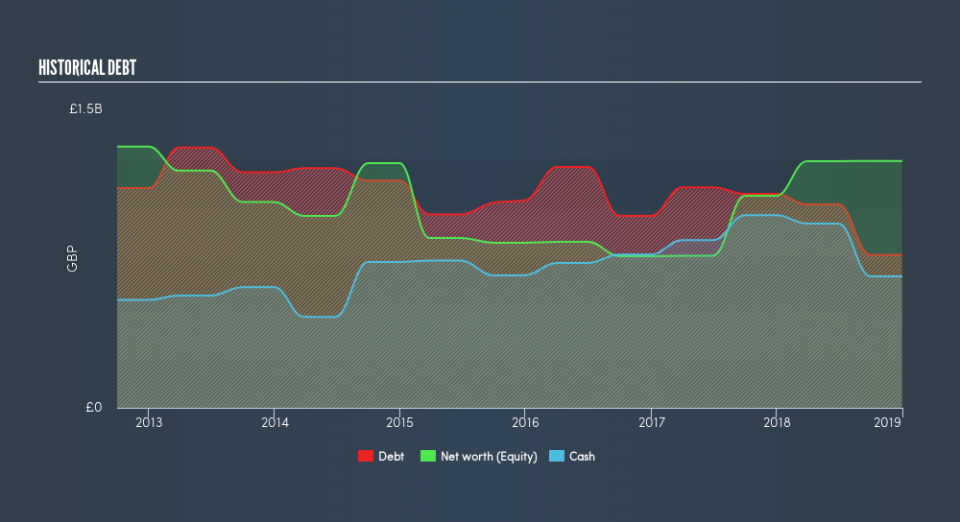
BBY has shrunk its total debt levels in the last twelve months, from UK£1.1b to UK£768m , which also accounts for long term debt. With this debt repayment, BBY's cash and short-term investments stands at UK£661m to keep the business going. Moving on, operating cash flow was negative over the last twelve months. As the purpose of this article is a high-level overview, I won’t be looking at this today, but you can take a look at some of BBY’s operating efficiency ratios such as ROA here.
Can BBY pay its short-term liabilities?
At the current liabilities level of UK£2.1b, the company arguably has a rather low level of current assets relative its obligations, with the current ratio last standing at 0.96x. The current ratio is calculated by dividing current assets by current liabilities.
Can BBY service its debt comfortably?
With a debt-to-equity ratio of 62%, BBY can be considered as an above-average leveraged company. This is somewhat unusual for small-caps companies, since lenders are often hesitant to provide attractive interest rates to less-established businesses. We can test if BBY’s debt levels are sustainable by measuring interest payments against earnings of a company. Ideally, earnings before interest and tax (EBIT) should cover net interest by at least three times. For BBY, the ratio of 3.71x suggests that interest is appropriately covered, which means that lenders may be inclined to lend more money to the company, as it is seen as safe in terms of payback.
Next Steps:
BBY’s high cash coverage means that, although its debt levels are high, the company is able to utilise its borrowings efficiently in order to generate cash flow. However, its lack of liquidity raises questions over current asset management practices for the small-cap. Keep in mind I haven't considered other factors such as how BBY has been performing in the past. You should continue to research Balfour Beatty to get a better picture of the stock by looking at:
Future Outlook: What are well-informed industry analysts predicting for BBY’s future growth? Take a look at our free research report of analyst consensus for BBY’s outlook.
Valuation: What is BBY worth today? Is the stock undervalued, even when its growth outlook is factored into its intrinsic value? The intrinsic value infographic in our free research report helps visualize whether BBY is currently mispriced by the market.
Other High-Performing Stocks: Are there other stocks that provide better prospects with proven track records? Explore our free list of these great stocks here.
We aim to bring you long-term focused research analysis driven by fundamental data. Note that our analysis may not factor in the latest price-sensitive company announcements or qualitative material.
If you spot an error that warrants correction, please contact the editor at editorial-team@simplywallst.com. This article by Simply Wall St is general in nature. It does not constitute a recommendation to buy or sell any stock, and does not take account of your objectives, or your financial situation. Simply Wall St has no position in the stocks mentioned. Thank you for reading.
