
 Yahoo Finance
 Does The Barco NV (EBR:BAR) Share Price Tend To Follow The Market?

If you own shares in Barco NV (EBR:BAR) then it’s worth thinking about how it contributes to the volatility of your portfolio, overall. In finance, Beta is a measure of volatility. Modern finance theory considers volatility to be a measure of risk, and there are two main types of price volatility. The first category is company specific volatility. This can be dealt with by limiting your exposure to any particular stock. The other type, which cannot be diversified away, is the volatility of the entire market. Every stock in the market is exposed to this volatility, which is linked to the fact that stocks prices are correlated in an efficient market.
Some stocks are more sensitive to general market forces than others. Some investors use beta as a measure of how much a certain stock is impacted by market risk (volatility). While we should keep in mind that Warren Buffett has cautioned that ‘Volatility is far from synonymous with risk’, beta is still a useful factor to consider. To make good use of it you must first know that the beta of the overall market is one. A stock with a beta below one is either less volatile than the market, or more volatile but not corellated with the overall market. In comparison a stock with a beta of over one tends to be move in a similar direction to the market in the long term, but with greater changes in price.
Check out our latest analysis for Barco
What does BAR’s beta value mean to investors?
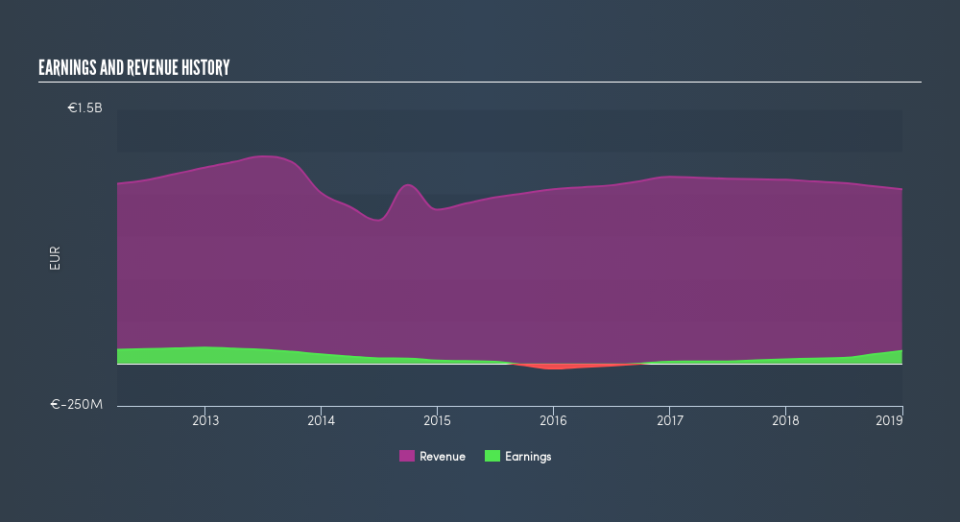
Given that it has a beta of 0.88, we can surmise that the Barco share price has not been strongly impacted by broader market volatility (over the last 5 years). This means that — if history is a guide — buying the stock would reduce the impact of overall market volatility in many portfolios (depending on the beta of the portfolio, of course). Many would argue that beta is useful in position sizing, but fundamental metrics such as revenue and earnings are more important overall. You can see Barco’s revenue and earnings in the image below.
Does BAR’s size influence the expected beta?
Barco is a small company, but not tiny and little known. It has a market capitalisation of €1.7b, which means it would be on the radar of intstitutional investors. Small cap stocks ofthen have a higher beta than the overall market. However, small companies can also be strongly impacted by company specific developments, which can move the share price in ways that are unrelated to the broader market. That could explain why this one has a low beta value.
What this means for you:
Since Barco is not heavily influenced by market moves, its share price is probably far more dependend on company specific developments. It could pay to take a closer look at metrics such as revenue growth, earnings growth, and debt. This article aims to educate investors about beta values, but it’s well worth looking at important company-specific fundamentals such as Barco’s financial health and performance track record. I highly recommend you dive deeper by considering the following:
Future Outlook: What are well-informed industry analysts predicting for BAR’s future growth? Take a look at our free research report of analyst consensus for BAR’s outlook.
Past Track Record: Has BAR been consistently performing well irrespective of the ups and downs in the market? Go into more detail in the past performance analysis and take a look at the free visual representations of BAR’s historicals for more clarity.
Other Interesting Stocks: It’s worth checking to see how BAR measures up against other companies on valuation. You could start with this free list of prospective options.
We aim to bring you long-term focused research analysis driven by fundamental data. Note that our analysis may not factor in the latest price-sensitive company announcements or qualitative material.
If you spot an error that warrants correction, please contact the editor at editorial-team@simplywallst.com. This article by Simply Wall St is general in nature. It does not constitute a recommendation to buy or sell any stock, and does not take account of your objectives, or your financial situation. Simply Wall St has no position in the stocks mentioned. Thank you for reading.
