
 Yahoo Finance
 How Does BGC Partners's (NASDAQ:BGCP) P/E Compare To Its Industry, After The Share Price Drop?

Unfortunately for some shareholders, the BGC Partners (NASDAQ:BGCP) share price has dived 33% in the last thirty days. Indeed the recent decline has arguably caused some bitterness for shareholders who have held through the 37% drop over twelve months.
All else being equal, a share price drop should make a stock more attractive to potential investors. While the market sentiment towards a stock is very changeable, in the long run, the share price will tend to move in the same direction as earnings per share. The implication here is that long term investors have an opportunity when expectations of a company are too low. One way to gauge market expectations of a stock is to look at its Price to Earnings Ratio (PE Ratio). A high P/E ratio means that investors have a high expectation about future growth, while a low P/E ratio means they have low expectations about future growth.
See our latest analysis for BGC Partners
Does BGC Partners Have A Relatively High Or Low P/E For Its Industry?
We can tell from its P/E ratio of 22.53 that sentiment around BGC Partners isn't particularly high. If you look at the image below, you can see BGC Partners has a lower P/E than the average (25.3) in the capital markets industry classification.
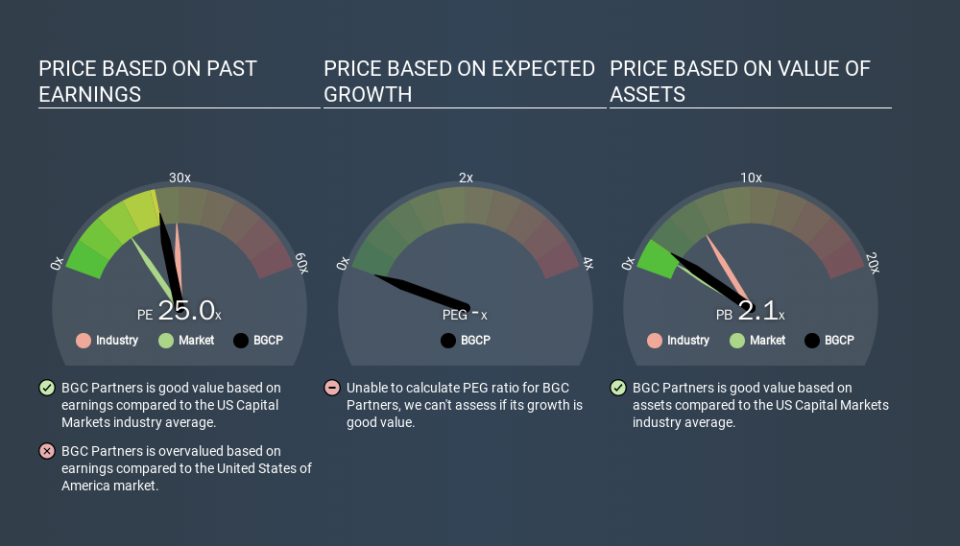
BGC Partners's P/E tells us that market participants think it will not fare as well as its peers in the same industry. While current expectations are low, the stock could be undervalued if the situation is better than the market assumes. If you consider the stock interesting, further research is recommended. For example, I often monitor director buying and selling.
How Growth Rates Impact P/E Ratios
Generally speaking the rate of earnings growth has a profound impact on a company's P/E multiple. If earnings are growing quickly, then the 'E' in the equation will increase faster than it would otherwise. Therefore, even if you pay a high multiple of earnings now, that multiple will become lower in the future. And as that P/E ratio drops, the company will look cheap, unless its share price increases.
BGC Partners saw earnings per share decrease by 26% last year.
A Limitation: P/E Ratios Ignore Debt and Cash In The Bank
It's important to note that the P/E ratio considers the market capitalization, not the enterprise value. Thus, the metric does not reflect cash or debt held by the company. Theoretically, a business can improve its earnings (and produce a lower P/E in the future) by investing in growth. That means taking on debt (or spending its cash).
Spending on growth might be good or bad a few years later, but the point is that the P/E ratio does not account for the option (or lack thereof).
Is Debt Impacting BGC Partners's P/E?
Net debt is 29% of BGC Partners's market cap. While it's worth keeping this in mind, it isn't a worry.
The Bottom Line On BGC Partners's P/E Ratio
BGC Partners trades on a P/E ratio of 22.5, which is above its market average of 13.3. With a bit of debt, but a lack of recent growth, it's safe to say the market is expecting improved profit performance from the company, in the next few years. Given BGC Partners's P/E ratio has declined from 33.7 to 22.5 in the last month, we know for sure that the market is significantly less confident about the business today, than it was back then. For those who prefer to invest with the flow of momentum, that might be a bad sign, but for a contrarian, it may signal opportunity.
When the market is wrong about a stock, it gives savvy investors an opportunity. If the reality for a company is better than it expects, you can make money by buying and holding for the long term. So this free visualization of the analyst consensus on future earnings could help you make the right decision about whether to buy, sell, or hold.
Of course you might be able to find a better stock than BGC Partners. So you may wish to see this free collection of other companies that have grown earnings strongly.
If you spot an error that warrants correction, please contact the editor at editorial-team@simplywallst.com. This article by Simply Wall St is general in nature. It does not constitute a recommendation to buy or sell any stock, and does not take account of your objectives, or your financial situation. Simply Wall St has no position in the stocks mentioned.
We aim to bring you long-term focused research analysis driven by fundamental data. Note that our analysis may not factor in the latest price-sensitive company announcements or qualitative material. Thank you for reading.
