
 Yahoo Finance
 Does Big Yellow Group Plc's (LON:BYG) Weak Fundamentals Mean That The Stock Could Move In The Opposite Direction?
Big Yellow Group's (LON:BYG) stock is up by 9.4% over the past three months. Given that the markets usually pay for the long-term financial health of a company, we wonder if the current momentum in the share price will keep up, given that the company's financials don't look very promising. In this article, we decided to focus on Big Yellow Group's ROE.
Return on equity or ROE is a key measure used to assess how efficiently a company's management is utilizing the company's capital. Put another way, it reveals the company's success at turning shareholder investments into profits.
See our latest analysis for Big Yellow Group
How To Calculate Return On Equity?
The formula for return on equity is:
Return on Equity = Net Profit (from continuing operations) ÷ Shareholders' Equity
So, based on the above formula, the ROE for Big Yellow Group is:
4.5% = UK£57m ÷ UK£1.3b (Based on the trailing twelve months to September 2020).
The 'return' is the yearly profit. That means that for every £1 worth of shareholders' equity, the company generated £0.04 in profit.
Why Is ROE Important For Earnings Growth?
Thus far, we have learned that ROE measures how efficiently a company is generating its profits. We now need to evaluate how much profit the company reinvests or "retains" for future growth which then gives us an idea about the growth potential of the company. Assuming all else is equal, companies that have both a higher return on equity and higher profit retention are usually the ones that have a higher growth rate when compared to companies that don't have the same features.
A Side By Side comparison of Big Yellow Group's Earnings Growth And 4.5% ROE
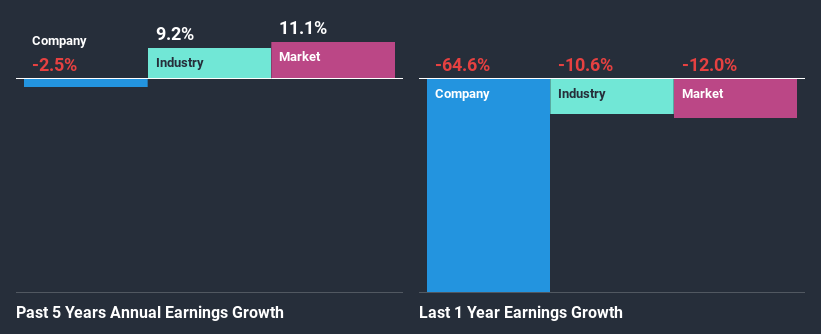
On the face of it, Big Yellow Group's ROE is not much to talk about. We then compared the company's ROE to the broader industry and were disappointed to see that the ROE is lower than the industry average of 5.6%. For this reason, Big Yellow Group's five year net income decline of 2.5% is not surprising given its lower ROE. However, there could also be other factors causing the earnings to decline. For instance, the company has a very high payout ratio, or is faced with competitive pressures.
That being said, we compared Big Yellow Group's performance with the industry and were concerned when we found that while the company has shrunk its earnings, the industry has grown its earnings at a rate of 9.2% in the same period.
Earnings growth is an important metric to consider when valuing a stock. The investor should try to establish if the expected growth or decline in earnings, whichever the case may be, is priced in. Doing so will help them establish if the stock's future looks promising or ominous. Is Big Yellow Group fairly valued compared to other companies? These 3 valuation measures might help you decide.
Is Big Yellow Group Efficiently Re-investing Its Profits?
Big Yellow Group has a very high three-year median payout ratio of 72%, implying that it retains only 28% of its profits. However, it's not unusual to see a REIT with such a high payout ratio mainly due to statutory requirements. So this probably explains the company's shrinking earnings.
In addition, Big Yellow Group has been paying dividends over a period of at least ten years suggesting that keeping up dividend payments is way more important to the management even if it comes at the cost of business growth. Based on the latest analysts' estimates, we found that the company's future payout ratio over the next three years is expected to hold steady at 84%. However, Big Yellow Group's ROE is predicted to rise to 5.9% despite there being no anticipated change in its payout ratio.
Conclusion
In total, we would have a hard think before deciding on any investment action concerning Big Yellow Group. The company has seen a lack of earnings growth as a result of retaining very little profits and whatever little it does retain, is being reinvested at a very low rate of return. With that said, we studied the latest analyst forecasts and found that while the company has shrunk its earnings in the past, analysts expect its earnings to grow in the future. Are these analysts expectations based on the broad expectations for the industry, or on the company's fundamentals? Click here to be taken to our analyst's forecasts page for the company.
This article by Simply Wall St is general in nature. It does not constitute a recommendation to buy or sell any stock, and does not take account of your objectives, or your financial situation. We aim to bring you long-term focused analysis driven by fundamental data. Note that our analysis may not factor in the latest price-sensitive company announcements or qualitative material. Simply Wall St has no position in any stocks mentioned.
Have feedback on this article? Concerned about the content? Get in touch with us directly. Alternatively, email editorial-team@simplywallst.com.
