
 Yahoo Finance
 What Does boohoo group plc's (LON:BOO) P/E Ratio Tell You?

The goal of this article is to teach you how to use price to earnings ratios (P/E ratios). We'll apply a basic P/E ratio analysis to boohoo group plc's (LON:BOO), to help you decide if the stock is worth further research. Looking at earnings over the last twelve months, boohoo group has a P/E ratio of 74.74. In other words, at today's prices, investors are paying £74.74 for every £1 in prior year profit.
See our latest analysis for boohoo group
How Do You Calculate A P/E Ratio?
The formula for price to earnings is:
Price to Earnings Ratio = Share Price ÷ Earnings per Share (EPS)
Or for boohoo group:
P/E of 74.74 = GBP3.29 ÷ GBP0.04 (Based on the trailing twelve months to August 2019.)
Is A High P/E Ratio Good?
A higher P/E ratio implies that investors pay a higher price for the earning power of the business. All else being equal, it's better to pay a low price -- but as Warren Buffett said, 'It's far better to buy a wonderful company at a fair price than a fair company at a wonderful price'.
Does boohoo group Have A Relatively High Or Low P/E For Its Industry?
We can get an indication of market expectations by looking at the P/E ratio. You can see in the image below that the average P/E (27.3) for companies in the online retail industry is lower than boohoo group's P/E.
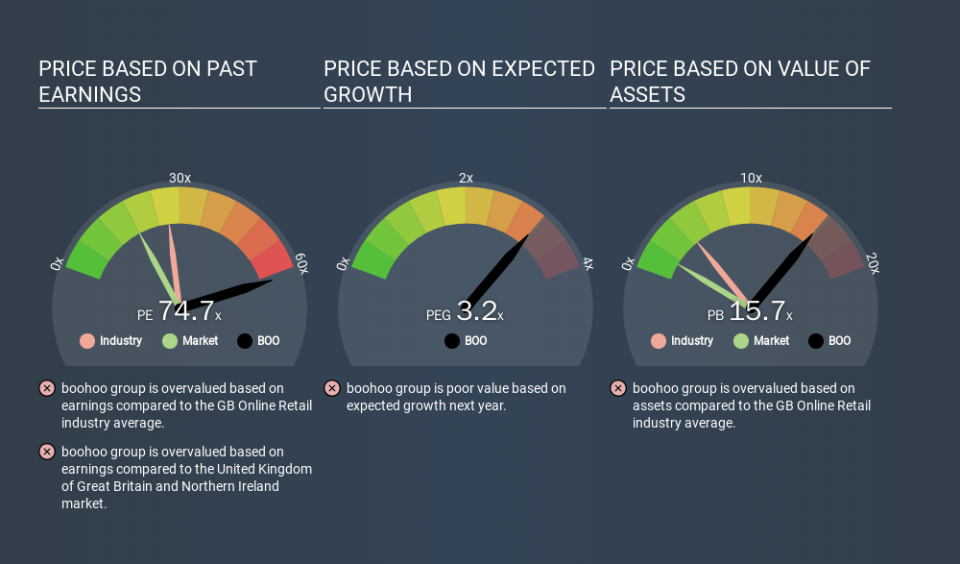
boohoo group's P/E tells us that market participants think the company will perform better than its industry peers, going forward. The market is optimistic about the future, but that doesn't guarantee future growth. So investors should delve deeper. I like to check if company insiders have been buying or selling.
How Growth Rates Impact P/E Ratios
Generally speaking the rate of earnings growth has a profound impact on a company's P/E multiple. If earnings are growing quickly, then the 'E' in the equation will increase faster than it would otherwise. That means even if the current P/E is high, it will reduce over time if the share price stays flat. Then, a lower P/E should attract more buyers, pushing the share price up.
boohoo group increased earnings per share by a whopping 49% last year. And earnings per share have improved by 41% annually, over the last five years. I'd therefore be a little surprised if its P/E ratio was not relatively high.
A Limitation: P/E Ratios Ignore Debt and Cash In The Bank
Don't forget that the P/E ratio considers market capitalization. So it won't reflect the advantage of cash, or disadvantage of debt. In theory, a company can lower its future P/E ratio by using cash or debt to invest in growth.
Spending on growth might be good or bad a few years later, but the point is that the P/E ratio does not account for the option (or lack thereof).
Is Debt Impacting boohoo group's P/E?
The extra options and safety that comes with boohoo group's UK£207m net cash position means that it deserves a higher P/E than it would if it had a lot of net debt.
The Bottom Line On boohoo group's P/E Ratio
With a P/E ratio of 74.7, boohoo group is expected to grow earnings very strongly in the years to come. The excess cash it carries is the gravy on top its fast EPS growth. So based on this analysis we'd expect boohoo group to have a high P/E ratio.
Investors should be looking to buy stocks that the market is wrong about. As value investor Benjamin Graham famously said, 'In the short run, the market is a voting machine but in the long run, it is a weighing machine. So this free visualization of the analyst consensus on future earnings could help you make the right decision about whether to buy, sell, or hold.
You might be able to find a better buy than boohoo group. If you want a selection of possible winners, check out this free list of interesting companies that trade on a P/E below 20 (but have proven they can grow earnings).
If you spot an error that warrants correction, please contact the editor at editorial-team@simplywallst.com. This article by Simply Wall St is general in nature. It does not constitute a recommendation to buy or sell any stock, and does not take account of your objectives, or your financial situation. Simply Wall St has no position in the stocks mentioned.
We aim to bring you long-term focused research analysis driven by fundamental data. Note that our analysis may not factor in the latest price-sensitive company announcements or qualitative material. Thank you for reading.
