
 Yahoo Finance
 What does Brembo S.p.A.'s (BIT:BRE) Balance Sheet Tell Us About Its Future?

Small-cap and large-cap companies receive a lot of attention from investors, but mid-cap stocks like Brembo S.p.A. (BIT:BRE), with a market cap of €3.2b, are often out of the spotlight. However, generally ignored mid-caps have historically delivered better risk-adjusted returns than the two other categories of stocks. Let’s take a look at BRE’s debt concentration and assess their financial liquidity to get an idea of their ability to fund strategic acquisitions and grow through cyclical pressures. Note that this commentary is very high-level and solely focused on financial health, so I suggest you dig deeper yourself into BRE here.
Want to participate in a short research study? Help shape the future of investing tools and you could win a $250 gift card!
Check out our latest analysis for Brembo
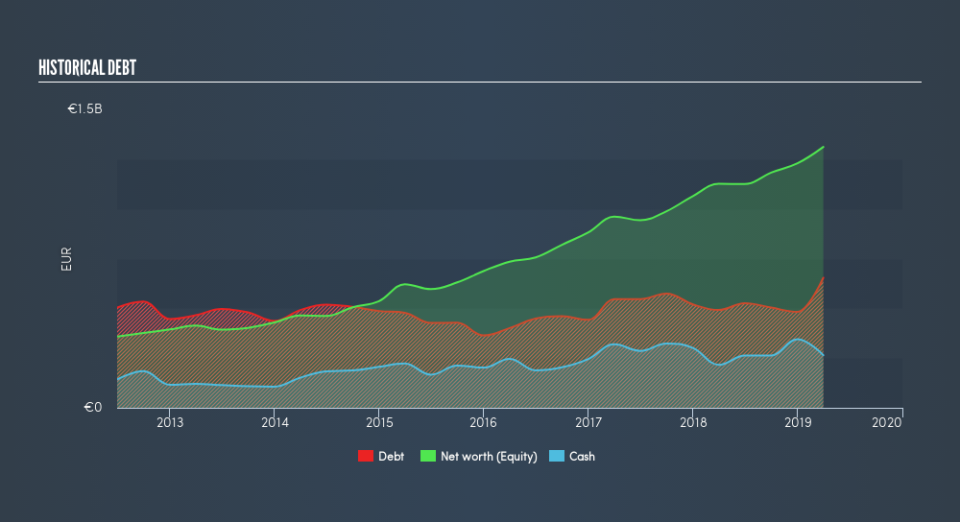
BRE’s Debt (And Cash Flows)
BRE's debt levels surged from €492m to €654m over the last 12 months , which includes long-term debt. With this increase in debt, BRE currently has €264m remaining in cash and short-term investments , ready to be used for running the business. Additionally, BRE has produced cash from operations of €426m in the last twelve months, resulting in an operating cash to total debt ratio of 65%, signalling that BRE’s debt is appropriately covered by operating cash.
Can BRE meet its short-term obligations with the cash in hand?
Looking at BRE’s €1.0b in current liabilities, it seems that the business has maintained a safe level of current assets to meet its obligations, with the current ratio last standing at 1.18x. The current ratio is the number you get when you divide current assets by current liabilities. Generally, for Auto Components companies, this is a reasonable ratio since there is a bit of a cash buffer without leaving too much capital in a low-return environment.
Does BRE face the risk of succumbing to its debt-load?
With debt reaching 50% of equity, BRE may be thought of as relatively highly levered. This is not uncommon for a mid-cap company given that debt tends to be lower-cost and at times, more accessible. We can test if BRE’s debt levels are sustainable by measuring interest payments against earnings of a company. Ideally, earnings before interest and tax (EBIT) should cover net interest by at least three times. For BRE, the ratio of 21.72x suggests that interest is comfortably covered, which means that lenders may be less hesitant to lend out more funding as BRE’s high interest coverage is seen as responsible and safe practice.
Next Steps:
BRE’s high cash coverage means that, although its debt levels are high, the company is able to utilise its borrowings efficiently in order to generate cash flow. Since there is also no concerns around BRE's liquidity needs, this may be its optimal capital structure for the time being. I admit this is a fairly basic analysis for BRE's financial health. Other important fundamentals need to be considered alongside. You should continue to research Brembo to get a more holistic view of the mid-cap by looking at:
Future Outlook: What are well-informed industry analysts predicting for BRE’s future growth? Take a look at our free research report of analyst consensus for BRE’s outlook.
Valuation: What is BRE worth today? Is the stock undervalued, even when its growth outlook is factored into its intrinsic value? The intrinsic value infographic in our free research report helps visualize whether BRE is currently mispriced by the market.
Other High-Performing Stocks: Are there other stocks that provide better prospects with proven track records? Explore our free list of these great stocks here.
We aim to bring you long-term focused research analysis driven by fundamental data. Note that our analysis may not factor in the latest price-sensitive company announcements or qualitative material.
If you spot an error that warrants correction, please contact the editor at editorial-team@simplywallst.com. This article by Simply Wall St is general in nature. It does not constitute a recommendation to buy or sell any stock, and does not take account of your objectives, or your financial situation. Simply Wall St has no position in the stocks mentioned. Thank you for reading.
