
 Yahoo Finance
 Does Britvic plc's (LON:BVIC) P/E Ratio Signal A Buying Opportunity?

The goal of this article is to teach you how to use price to earnings ratios (P/E ratios). We'll look at Britvic plc's (LON:BVIC) P/E ratio and reflect on what it tells us about the company's share price. Based on the last twelve months, Britvic's P/E ratio is 20.63. That corresponds to an earnings yield of approximately 4.8%.
Want to participate in a short research study? Help shape the future of investing tools and you could win a $250 gift card!
Check out our latest analysis for Britvic
How Do I Calculate A Price To Earnings Ratio?
The formula for P/E is:
Price to Earnings Ratio = Price per Share ÷ Earnings per Share (EPS)
Or for Britvic:
P/E of 20.63 = £9.16 ÷ £0.44 (Based on the trailing twelve months to September 2018.)
Is A High Price-to-Earnings Ratio Good?
A higher P/E ratio means that buyers have to pay a higher price for each £1 the company has earned over the last year. That isn't necessarily good or bad, but a high P/E implies relatively high expectations of what a company can achieve in the future.
How Growth Rates Impact P/E Ratios
Earnings growth rates have a big influence on P/E ratios. Earnings growth means that in the future the 'E' will be higher. And in that case, the P/E ratio itself will drop rather quickly. So while a stock may look expensive based on past earnings, it could be cheap based on future earnings.
Britvic's earnings per share grew by -4.6% in the last twelve months. And earnings per share have improved by 12% annually, over the last five years.
How Does Britvic's P/E Ratio Compare To Its Peers?
The P/E ratio essentially measures market expectations of a company. The image below shows that Britvic has a lower P/E than the average (26.7) P/E for companies in the beverage industry.
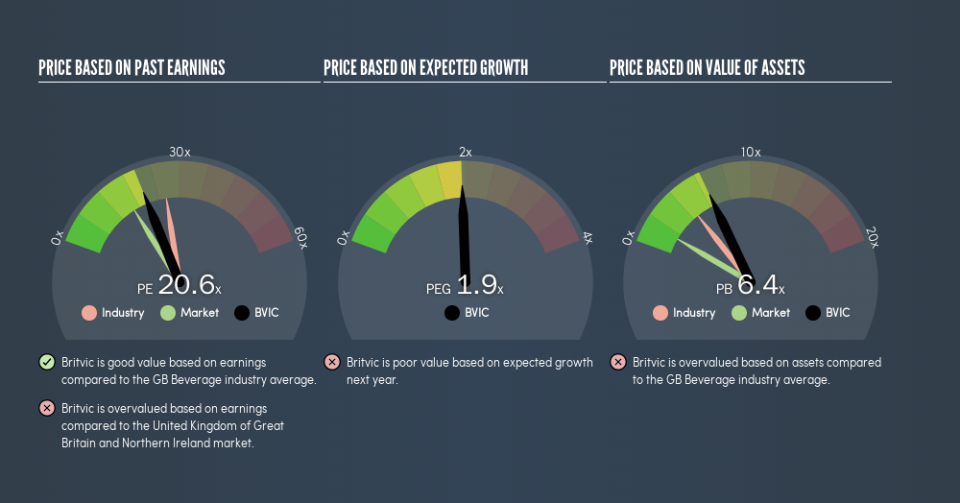
Its relatively low P/E ratio indicates that Britvic shareholders think it will struggle to do as well as other companies in its industry classification. While current expectations are low, the stock could be undervalued if the situation is better than the market assumes. It is arguably worth checking if insiders are buying shares, because that might imply they believe the stock is undervalued.
Don't Forget: The P/E Does Not Account For Debt or Bank Deposits
It's important to note that the P/E ratio considers the market capitalization, not the enterprise value. Thus, the metric does not reflect cash or debt held by the company. Theoretically, a business can improve its earnings (and produce a lower P/E in the future) by investing in growth. That means taking on debt (or spending its cash).
Such spending might be good or bad, overall, but the key point here is that you need to look at debt to understand the P/E ratio in context.
How Does Britvic's Debt Impact Its P/E Ratio?
Net debt is 26% of Britvic's market cap. You'd want to be aware of this fact, but it doesn't bother us.
The Bottom Line On Britvic's P/E Ratio
Britvic has a P/E of 20.6. That's higher than the average in the GB market, which is 16.3. With modest debt relative to its size, and modest earnings growth, the market is likely expecting sustained long-term growth, if not a near-term improvement.
When the market is wrong about a stock, it gives savvy investors an opportunity. If the reality for a company is better than it expects, you can make money by buying and holding for the long term. So this free report on the analyst consensus forecasts could help you make a master move on this stock.
You might be able to find a better buy than Britvic. If you want a selection of possible winners, check out this free list of interesting companies that trade on a P/E below 20 (but have proven they can grow earnings).
We aim to bring you long-term focused research analysis driven by fundamental data. Note that our analysis may not factor in the latest price-sensitive company announcements or qualitative material.
If you spot an error that warrants correction, please contact the editor at editorial-team@simplywallst.com. This article by Simply Wall St is general in nature. It does not constitute a recommendation to buy or sell any stock, and does not take account of your objectives, or your financial situation. Simply Wall St has no position in the stocks mentioned. Thank you for reading.
