
 Yahoo Finance
 How Does CENIT's (ETR:CSH) P/E Compare To Its Industry, After The Share Price Drop?

To the annoyance of some shareholders, CENIT (ETR:CSH) shares are down a considerable 33% in the last month. Indeed the recent decline has arguably caused some bitterness for shareholders who have held through the 38% drop over twelve months.
All else being equal, a share price drop should make a stock more attractive to potential investors. In the long term, share prices tend to follow earnings per share, but in the short term prices bounce around in response to short term factors (which are not always obvious). The implication here is that long term investors have an opportunity when expectations of a company are too low. One way to gauge market expectations of a stock is to look at its Price to Earnings Ratio (PE Ratio). A high P/E ratio means that investors have a high expectation about future growth, while a low P/E ratio means they have low expectations about future growth.
See our latest analysis for CENIT
How Does CENIT's P/E Ratio Compare To Its Peers?
CENIT's P/E of 13.06 indicates relatively low sentiment towards the stock. We can see in the image below that the average P/E (33.5) for companies in the software industry is higher than CENIT's P/E.
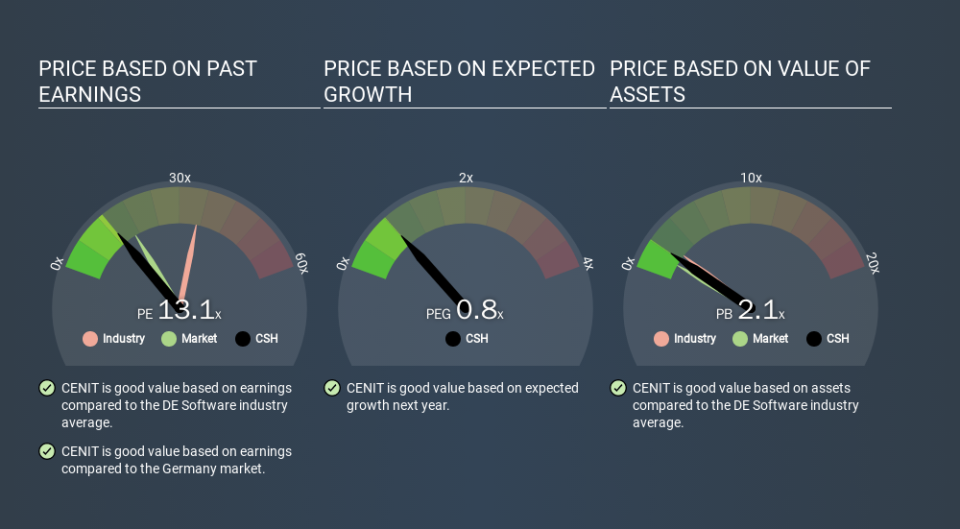
This suggests that market participants think CENIT will underperform other companies in its industry. Since the market seems unimpressed with CENIT, it's quite possible it could surprise on the upside. If you consider the stock interesting, further research is recommended. For example, I often monitor director buying and selling.
How Growth Rates Impact P/E Ratios
Companies that shrink earnings per share quickly will rapidly decrease the 'E' in the equation. Therefore, even if you pay a low multiple of earnings now, that multiple will become higher in the future. Then, a higher P/E might scare off shareholders, pushing the share price down.
CENIT's earnings per share fell by 23% in the last twelve months. And it has shrunk its earnings per share by 3.1% per year over the last five years. This might lead to muted expectations.
Remember: P/E Ratios Don't Consider The Balance Sheet
It's important to note that the P/E ratio considers the market capitalization, not the enterprise value. That means it doesn't take debt or cash into account. Hypothetically, a company could reduce its future P/E ratio by spending its cash (or taking on debt) to achieve higher earnings.
Such expenditure might be good or bad, in the long term, but the point here is that the balance sheet is not reflected by this ratio.
So What Does CENIT's Balance Sheet Tell Us?
CENIT has net cash of €22m. This is fairly high at 30% of its market capitalization. That might mean balance sheet strength is important to the business, but should also help push the P/E a bit higher than it would otherwise be.
The Bottom Line On CENIT's P/E Ratio
CENIT has a P/E of 13.1. That's below the average in the DE market, which is 15.8. The recent drop in earnings per share would almost certainly temper expectations, but the net cash position means the company has time to improve: if so, the low P/E could be an opportunity. Given CENIT's P/E ratio has declined from 19.4 to 13.1 in the last month, we know for sure that the market is significantly less confident about the business today, than it was back then. For those who don't like to trade against momentum, that could be a warning sign, but a contrarian investor might want to take a closer look.
When the market is wrong about a stock, it gives savvy investors an opportunity. If the reality for a company is not as bad as the P/E ratio indicates, then the share price should increase as the market realizes this. So this free report on the analyst consensus forecasts could help you make a master move on this stock.
You might be able to find a better buy than CENIT. If you want a selection of possible winners, check out this free list of interesting companies that trade on a P/E below 20 (but have proven they can grow earnings).
If you spot an error that warrants correction, please contact the editor at editorial-team@simplywallst.com. This article by Simply Wall St is general in nature. It does not constitute a recommendation to buy or sell any stock, and does not take account of your objectives, or your financial situation. Simply Wall St has no position in the stocks mentioned.
We aim to bring you long-term focused research analysis driven by fundamental data. Note that our analysis may not factor in the latest price-sensitive company announcements or qualitative material. Thank you for reading.
