
 Yahoo Finance
 Does Cisco Systems Inc’s (NASDAQ:CSCO) Debt Level Pose A Problem?

There are a number of reasons that attract investors towards large-cap companies such as Cisco Systems Inc (NASDAQ:CSCO), with a market cap of US$206.97B. Doing business globally, large caps tend to have diversified revenue streams and attractive capital returns, making them desirable investments for risk-averse portfolios. But, the key to their continued success lies in its financial health. Today we will look at Cisco Systems’s financial liquidity and debt levels, which are strong indicators for whether the company can weather economic downturns or fund strategic acquisitions for future growth. Note that this commentary is very high-level and solely focused on financial health, so I suggest you dig deeper yourself into CSCO here. See our latest analysis for Cisco Systems
How much cash does CSCO generate through its operations?
CSCO’s debt levels surged from US$28.64B to US$33.72B over the last 12 months – this includes both the current and long-term debt. With this increase in debt, the current cash and short-term investment levels stands at US$70.49B for investing into the business. Moreover, CSCO has produced US$13.88B in operating cash flow in the last twelve months, leading to an operating cash to total debt ratio of 41.15%, signalling that CSCO’s operating cash is sufficient to cover its debt. This ratio can also be a sign of operational efficiency for loss making businesses as traditional metrics such as return on asset (ROA) requires a positive net income. In CSCO’s case, it is able to generate 0.41x cash from its debt capital.
Can CSCO meet its short-term obligations with the cash in hand?
At the current liabilities level of US$27.58B liabilities, it seems that the business has been able to meet these obligations given the level of current assets of US$83.70B, with a current ratio of 3.03x. However, anything above 3x is considered high and could mean that CSCO has too much idle capital in low-earning investments.
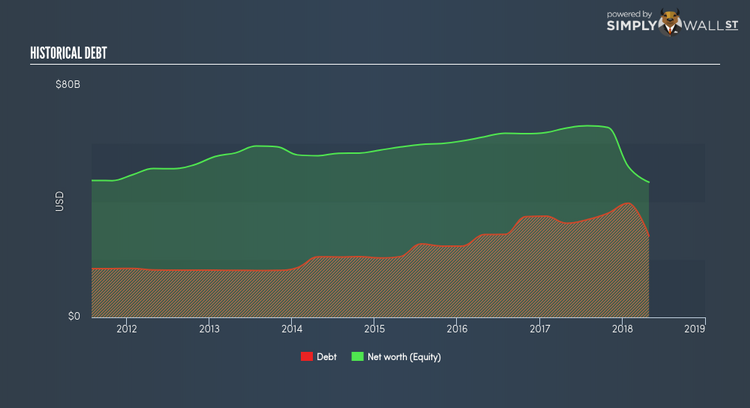
Does CSCO face the risk of succumbing to its debt-load?
With debt reaching 60.30% of equity, CSCO may be thought of as relatively highly levered. This isn’t uncommon for large companies because interest payments on debt are tax deductible, meaning debt can be a cheaper source of capital than equity. Accordingly, large companies often have lower cost of capital due to easily obtained financing, providing an advantage over smaller companies. However, since CSCO is currently unprofitable, there’s a question of sustainability of its current operations. Running high debt, while not yet making money, can be risky in unexpected downturns as liquidity may dry up, making it hard to operate.
Next Steps:
CSCO’s high cash coverage means that, although its debt levels are high, the company is able to utilise its borrowings efficiently in order to generate cash flow. This may mean this is an optimal capital structure for the business, given that it is also meeting its short-term commitment. This is only a rough assessment of financial health, and I’m sure CSCO has company-specific issues impacting its capital structure decisions. You should continue to research Cisco Systems to get a better picture of the large-cap by looking at:
Future Outlook: What are well-informed industry analysts predicting for CSCO’s future growth? Take a look at our free research report of analyst consensus for CSCO’s outlook.
Valuation: What is CSCO worth today? Is the stock undervalued, even when its growth outlook is factored into its intrinsic value? The intrinsic value infographic in our free research report helps visualize whether CSCO is currently mispriced by the market.
Other High-Performing Stocks: Are there other stocks that provide better prospects with proven track records? Explore our free list of these great stocks here.
To help readers see pass the short term volatility of the financial market, we aim to bring you a long-term focused research analysis purely driven by fundamental data. Note that our analysis does not factor in the latest price sensitive company announcements.
The author is an independent contributor and at the time of publication had no position in the stocks mentioned.
