
 Yahoo Finance
 Does Clipper Logistics plc’s (LON:CLG) 14.6% Earnings Growth Make It An Outperformer?

After reading Clipper Logistics plc’s (LON:CLG) most recent earnings announcement (30 April 2018), I found it useful to look back at how the company has performed in the past and compare this against the latest numbers. As a long-term investor I tend to focus on earnings trend, rather than a single number at one point in time. Also, comparing it against an industry benchmark to understand whether it outperformed, or is simply riding an industry wave, is a crucial aspect. Below is a brief commentary on my key takeaways.
Check out our latest analysis for Clipper Logistics
How Did CLG’s Recent Performance Stack Up Against Its Past?
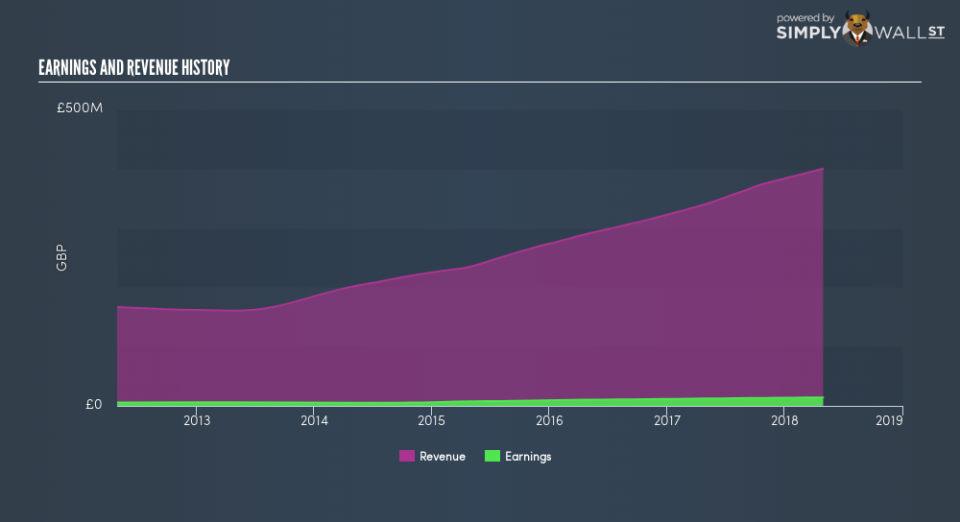
CLG’s trailing twelve-month earnings (from 30 April 2018) of UK£14.3m has jumped 14.6% compared to the previous year. However, this one-year growth rate has been lower than its average earnings growth rate over the past 5 years of 19.2%, indicating the rate at which CLG is growing has slowed down. What could be happening here? Well, let’s look at what’s occurring with margins and if the whole industry is facing the same headwind.
In the last few years, revenue growth has not been able to catch up, which indicates that Clipper Logistics’s bottom line has been driven by unsustainable cost-reductions. Inspecting growth from a sector-level, the UK commercial services industry has been growing, albeit, at a unexciting single-digit rate of 4.3% in the past twelve months, and a substantial 17.5% over the past five. This growth is a median of profitable companies of 19 Commercial Services companies in GB including AssetCo, Rentokil Initial and Premier Technical Services Group. This means that whatever near-term headwind the industry is experiencing, Clipper Logistics is relatively better-cushioned than its peers.
In terms of returns from investment, Clipper Logistics has invested its equity funds well leading to a 36.3% return on equity (ROE), above the sensible minimum of 20%. Furthermore, its return on assets (ROA) of 8.9% exceeds the GB Commercial Services industry of 5.4%, indicating Clipper Logistics has used its assets more efficiently. However, its return on capital (ROC), which also accounts for Clipper Logistics’s debt level, has declined over the past 3 years from 37.0% to 22.8%. This correlates with an increase in debt holding, with debt-to-equity ratio rising from 29.6% to 139% over the past 5 years.
What does this mean?
While past data is useful, it doesn’t tell the whole story. Companies that have performed well in the past, such as Clipper Logistics gives investors conviction. However, the next step would be to assess whether the future looks as optimistic. I suggest you continue to research Clipper Logistics to get a more holistic view of the stock by looking at:
Future Outlook: What are well-informed industry analysts predicting for CLG’s future growth? Take a look at our free research report of analyst consensus for CLG’s outlook.
Financial Health: Are CLG’s operations financially sustainable? Balance sheets can be hard to analyze, which is why we’ve done it for you. Check out our financial health checks here.
Other High-Performing Stocks: Are there other stocks that provide better prospects with proven track records? Explore our free list of these great stocks here.
NB: Figures in this article are calculated using data from the trailing twelve months from 30 April 2018. This may not be consistent with full year annual report figures.
To help readers see past the short term volatility of the financial market, we aim to bring you a long-term focused research analysis purely driven by fundamental data. Note that our analysis does not factor in the latest price-sensitive company announcements.
The author is an independent contributor and at the time of publication had no position in the stocks mentioned. For errors that warrant correction please contact the editor at editorial-team@simplywallst.com.
