
 Yahoo Finance
 Does Commercial Vehicle Group Inc’s (NASDAQ:CVGI) CEO Pay Compare Well With Peers?

In 2015 Pat Miller was appointed CEO of Commercial Vehicle Group Inc (NASDAQ:CVGI). This report will, first, examine the CEO compensation levels in comparison to CEO compensation at companies of similar size. Then we’ll look at a snap shot of the business growth. Third, we’ll reflect on the total return to shareholders over three years, as a second measure of business performance. This method should give us information to assess how appropriately the company pays the CEO.
See our latest analysis for Commercial Vehicle Group
How Does Pat Miller’s Compensation Compare With Similar Sized Companies?
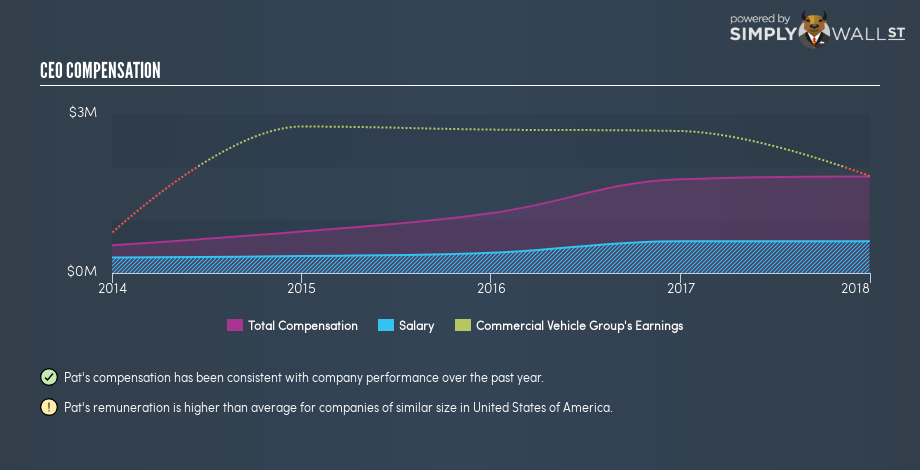
At the time of writing our data says that Commercial Vehicle Group Inc has a market cap of US$203m, and is paying total annual CEO compensation of US$1.8m. (This figure is for the year to 2017). We think total compensation is more important but we note that the CEO salary is lower, at US$600k. We looked at a group of companies with market capitalizations from US$100m to US$400m, and the median CEO compensation was US$942k.
As you can see, Pat Miller is paid more than the median CEO pay at companies of a similar size, in the same market. However, this does not necessarily mean Commercial Vehicle Group Inc is paying too much. We can better assess whether the pay is overly generous by looking into the underlying business performance.
You can see, below, how CEO compensation at Commercial Vehicle Group has changed over time.
Is Commercial Vehicle Group Inc Growing?
Over the last three years Commercial Vehicle Group Inc has grown its earnings per share (EPS) by an average of 33% per year. Its revenue is up 20% over last year.
This demonstrates that the company has been improving recently. A good result. It’s also good to see decent revenue growth in the last year, suggesting the business is healthy and growing.
Although we don’t have analyst forecasts, you could get a better understanding of its growth by checking out this more detailed historical graph of earnings, revenue and cash flow.
Has Commercial Vehicle Group Inc Been A Good Investment?
Most shareholders would probably be pleased with Commercial Vehicle Group Inc for providing a total return of 97% over three years. As a result, some may believe the CEO should be paid more than is normal for companies of similar size.
In Summary…
We compared total CEO remuneration at Commercial Vehicle Group Inc with the amount paid at companies with a similar market capitalization. We found that it pays well over the median amount paid in the benchmark group.
However we must not forget that the EPS growth has been very strong over three years. In addition, shareholders have done well over the same time period. As a result of this good performance, the CEO remuneration may well be quite reasonable. Shareholders may want to check for free if Commercial Vehicle Group insiders are buying or selling shares.
Or you might prefer this data-rich interactive visualization of historic revenue and earnings.
To help readers see past the short term volatility of the financial market, we aim to bring you a long-term focused research analysis purely driven by fundamental data. Note that our analysis does not factor in the latest price-sensitive company announcements.
The author is an independent contributor and at the time of publication had no position in the stocks mentioned. For errors that warrant correction please contact the editor at editorial-team@simplywallst.com.
