
 Yahoo Finance
 Does Dignity plc (LON:DTY) Have A Good P/E Ratio?

Want to participate in a short research study? Help shape the future of investing tools and you could win a $250 gift card!
The goal of this article is to teach you how to use price to earnings ratios (P/E ratios). We'll look at Dignity plc's (LON:DTY) P/E ratio and reflect on what it tells us about the company's share price. Dignity has a price to earnings ratio of 10.74, based on the last twelve months. That corresponds to an earnings yield of approximately 9.3%.
Check out our latest analysis for Dignity
How Do I Calculate A Price To Earnings Ratio?
The formula for price to earnings is:
Price to Earnings Ratio = Price per Share ÷ Earnings per Share (EPS)
Or for Dignity:
P/E of 10.74 = £6.77 ÷ £0.63 (Based on the trailing twelve months to December 2018.)
Is A High P/E Ratio Good?
A higher P/E ratio means that buyers have to pay a higher price for each £1 the company has earned over the last year. That isn't necessarily good or bad, but a high P/E implies relatively high expectations of what a company can achieve in the future.
How Growth Rates Impact P/E Ratios
If earnings fall then in the future the 'E' will be lower. That means unless the share price falls, the P/E will increase in a few years. A higher P/E should indicate the stock is expensive relative to others -- and that may encourage shareholders to sell.
Dignity shrunk earnings per share by 46% over the last year. And it has shrunk its earnings per share by 4.5% per year over the last five years. This could justify a pessimistic P/E.
How Does Dignity's P/E Ratio Compare To Its Peers?
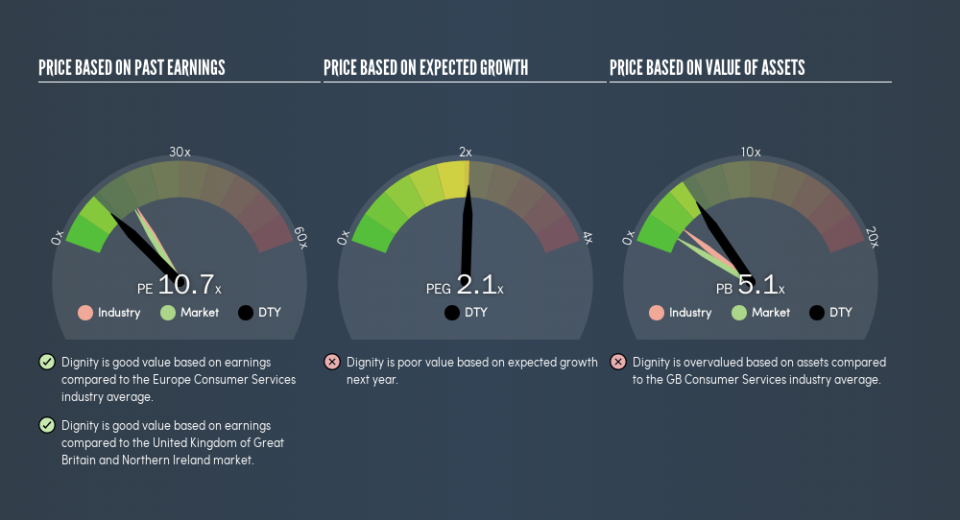
We can get an indication of market expectations by looking at the P/E ratio. The image below shows that Dignity has a lower P/E than the average (17.2) P/E for companies in the consumer services industry.
Dignity's P/E tells us that market participants think it will not fare as well as its peers in the same industry. Since the market seems unimpressed with Dignity, it's quite possible it could surprise on the upside. You should delve deeper. I like to check if company insiders have been buying or selling.
Don't Forget: The P/E Does Not Account For Debt or Bank Deposits
Don't forget that the P/E ratio considers market capitalization. Thus, the metric does not reflect cash or debt held by the company. Theoretically, a business can improve its earnings (and produce a lower P/E in the future) by investing in growth. That means taking on debt (or spending its cash).
While growth expenditure doesn't always pay off, the point is that it is a good option to have; but one that the P/E ratio ignores.
Dignity's Balance Sheet
Dignity has net debt worth a very significant 146% of its market capitalization. This level of debt justifies a relatively low P/E, so remain cognizant of the debt, if you're comparing it to other stocks.
The Verdict On Dignity's P/E Ratio
Dignity has a P/E of 10.7. That's below the average in the GB market, which is 16.3. The P/E reflects market pessimism that probably arises from the lack of recent EPS growth, paired with significant leverage.
When the market is wrong about a stock, it gives savvy investors an opportunity. If the reality for a company is not as bad as the P/E ratio indicates, then the share price should increase as the market realizes this. So this free report on the analyst consensus forecasts could help you make a master move on this stock.
Of course, you might find a fantastic investment by looking at a few good candidates. So take a peek at this free list of companies with modest (or no) debt, trading on a P/E below 20.
We aim to bring you long-term focused research analysis driven by fundamental data. Note that our analysis may not factor in the latest price-sensitive company announcements or qualitative material.
If you spot an error that warrants correction, please contact the editor at editorial-team@simplywallst.com. This article by Simply Wall St is general in nature. It does not constitute a recommendation to buy or sell any stock, and does not take account of your objectives, or your financial situation. Simply Wall St has no position in the stocks mentioned. Thank you for reading.
