
 Yahoo Finance
 Does Dycom Industries, Inc.'s (NYSE:DY) CEO Pay Compare Well With Peers?

Steve Nielsen became the CEO of Dycom Industries, Inc. (NYSE:DY) in 1999. This analysis aims first to contrast CEO compensation with other companies that have similar market capitalization. After that, we will consider the growth in the business. And finally we will reflect on how common stockholders have fared in the last few years, as a secondary measure of performance. This method should give us information to assess how appropriately the company pays the CEO.
See our latest analysis for Dycom Industries
How Does Steve Nielsen's Compensation Compare With Similar Sized Companies?
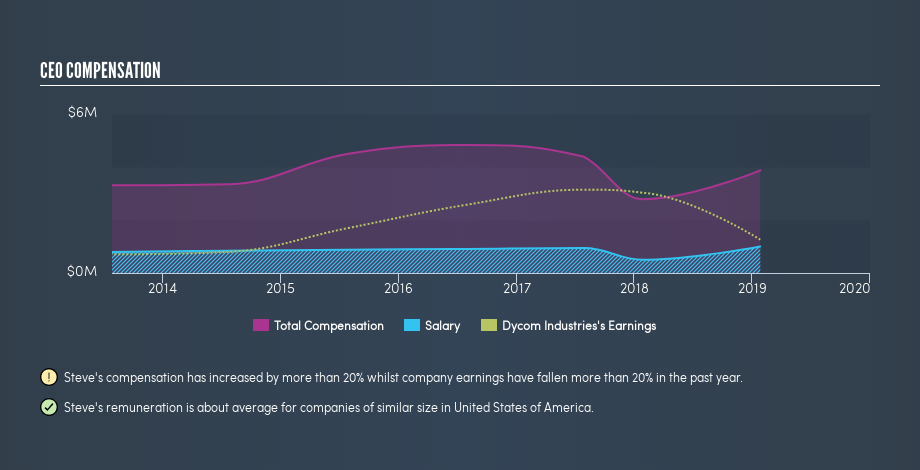
At the time of writing our data says that Dycom Industries, Inc. has a market cap of US$1.3b, and is paying total annual CEO compensation of US$3.9m. (This number is for the twelve months until January 2019). We think total compensation is more important but we note that the CEO salary is lower, at US$1.0m. We examined companies with market caps from US$1.0b to US$3.2b, and discovered that the median CEO total compensation of that group was US$4.1m.
So Steve Nielsen receives a similar amount to the median CEO pay, amongst the companies we looked at. While this data point isn't particularly informative alone, it gains more meaning when considered with business performance.
The graphic below shows how CEO compensation at Dycom Industries has changed from year to year.
Is Dycom Industries, Inc. Growing?
On average over the last three years, Dycom Industries, Inc. has shrunk earnings per share by 18% each year (measured with a line of best fit). In the last year, its revenue is up 10%.
Few shareholders would be pleased to read that earnings per share are lower over three years. While the revenue growth is good to see, it is outweighed by the fact that earnings per share are down, over three years. These factors suggest that the business performance wouldn't really justify a high pay packet for the CEO. You might want to check this free visual report on analyst forecasts for future earnings.
Has Dycom Industries, Inc. Been A Good Investment?
With a three year total loss of 49%, Dycom Industries, Inc. would certainly have some dissatisfied shareholders. This suggests it would be unwise for the company to pay the CEO too generously.
In Summary...
Steve Nielsen is paid around the same as most CEOs of similar size companies.
After looking at EPS and total shareholder returns, it's certainly hard to argue the company has performed well, since both metrics are down. Few would argue that it's wise for the company to pay any more, before returns improve. CEO compensation is one thing, but it is also interesting to check if the CEO is buying or selling Dycom Industries (free visualization of insider trades).
Arguably, business quality is much more important than CEO compensation levels. So check out this free list of interesting companies, that have HIGH return on equity and low debt.
We aim to bring you long-term focused research analysis driven by fundamental data. Note that our analysis may not factor in the latest price-sensitive company announcements or qualitative material.
If you spot an error that warrants correction, please contact the editor at editorial-team@simplywallst.com. This article by Simply Wall St is general in nature. It does not constitute a recommendation to buy or sell any stock, and does not take account of your objectives, or your financial situation. Simply Wall St has no position in the stocks mentioned. Thank you for reading.
