
 Yahoo Finance
 Does EVI Industries, Inc.'s (NYSEMKT:EVI) CEO Pay Reflect Performance?

Want to participate in a short research study? Help shape the future of investing tools and you could win a $250 gift card!
In 2015 Henry Nahmad was appointed CEO of EVI Industries, Inc. (NYSEMKT:EVI). This report will, first, examine the CEO compensation levels in comparison to CEO compensation at companies of similar size. Next, we'll consider growth that the business demonstrates. And finally we will reflect on how common stockholders have fared in the last few years, as a secondary measure of performance. The aim of all this is to consider the appropriateness of CEO pay levels.
Check out our latest analysis for EVI Industries
How Does Henry Nahmad's Compensation Compare With Similar Sized Companies?
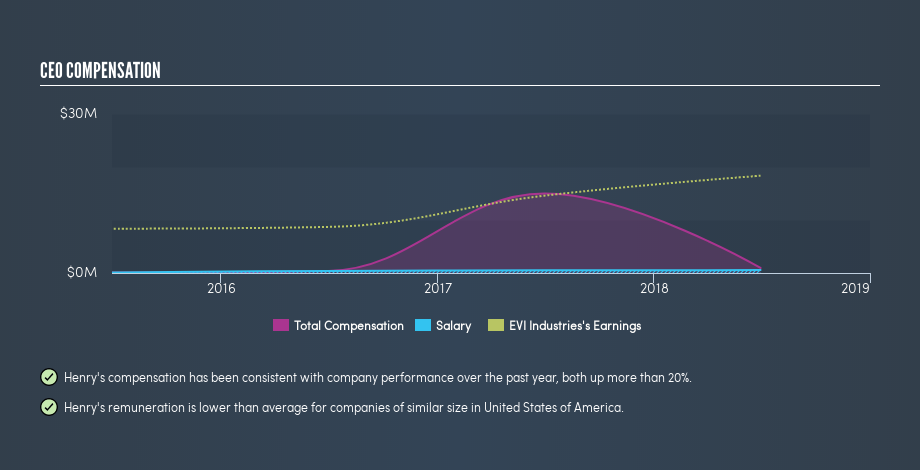
At the time of writing our data says that EVI Industries, Inc. has a market cap of US$432m, and is paying total annual CEO compensation of US$950k. (This number is for the twelve months until June 2018). While this analysis focuses on total compensation, it's worth noting the salary is lower, valued at US$550k. We examined companies with market caps from US$200m to US$800m, and discovered that the median CEO total compensation of that group was US$1.7m.
A first glance this seems like a real positive for shareholders, since Henry Nahmad is paid less than the average total compensation paid by similar sized companies. However, before we heap on the praise, we should delve deeper to understand business performance.
You can see, below, how CEO compensation at EVI Industries has changed over time.
Is EVI Industries, Inc. Growing?
On average over the last three years, EVI Industries, Inc. has grown earnings per share (EPS) by 6.0% each year (using a line of best fit). It achieved revenue growth of 57% over the last year.
It's hard to interpret the strong revenue growth as anything other than a positive. And in that context, the modest EPS improvement certainly isn't shabby. I wouldn't say this is necessarily top notch growth, but it is certainly promising. We don't have analyst forecasts, but shareholders might want to examine this detailed historical graph of earnings, revenue and cash flow.
Has EVI Industries, Inc. Been A Good Investment?
I think that the total shareholder return of 848%, over three years, would leave most EVI Industries, Inc. shareholders smiling. As a result, some may believe the CEO should be paid more than is normal for companies of similar size.
In Summary...
It looks like EVI Industries, Inc. pays its CEO less than similar sized companies.
Henry Nahmad is paid less than what is normal at similar size companies, and the total shareholder return has been pleasing over the last three years. We would like to see EPS growth, but in our view it seems the CEO is modestly remunerated. Whatever your view on compensation, you might want to check if insiders are buying or selling EVI Industries shares (free trial).
Important note: EVI Industries may not be the best stock to buy. You might find something better in this list of interesting companies with high ROE and low debt.
We aim to bring you long-term focused research analysis driven by fundamental data. Note that our analysis may not factor in the latest price-sensitive company announcements or qualitative material.
If you spot an error that warrants correction, please contact the editor at editorial-team@simplywallst.com. This article by Simply Wall St is general in nature. It does not constitute a recommendation to buy or sell any stock, and does not take account of your objectives, or your financial situation. Simply Wall St has no position in the stocks mentioned. Thank you for reading.