
 Yahoo Finance
 Does Evli Pankki Oyj (HEL:EVLI) Have A Good P/E Ratio?

Today, we'll introduce the concept of the P/E ratio for those who are learning about investing. We'll apply a basic P/E ratio analysis to Evli Pankki Oyj's (HEL:EVLI), to help you decide if the stock is worth further research. What is Evli Pankki Oyj's P/E ratio? Well, based on the last twelve months it is 14.99. That means that at current prices, buyers pay €14.99 for every €1 in trailing yearly profits.
See our latest analysis for Evli Pankki Oyj
How Do I Calculate A Price To Earnings Ratio?
The formula for price to earnings is:
Price to Earnings Ratio = Price per Share ÷ Earnings per Share (EPS)
Or for Evli Pankki Oyj:
P/E of 14.99 = €8.38 ÷ €0.56 (Based on the trailing twelve months to June 2019.)
Is A High P/E Ratio Good?
A higher P/E ratio means that investors are paying a higher price for each €1 of company earnings. That isn't a good or a bad thing on its own, but a high P/E means that buyers have a higher opinion of the business's prospects, relative to stocks with a lower P/E.
Does Evli Pankki Oyj Have A Relatively High Or Low P/E For Its Industry?
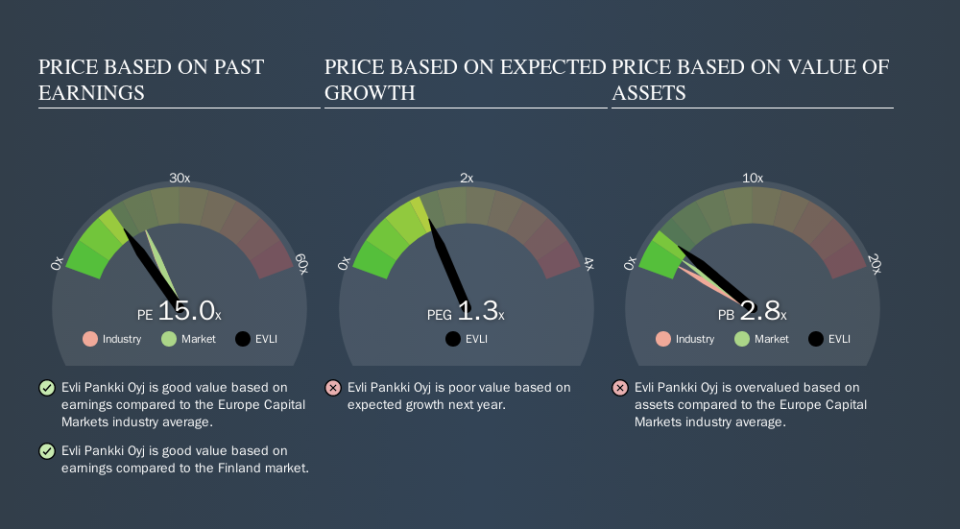
The P/E ratio indicates whether the market has higher or lower expectations of a company. The image below shows that Evli Pankki Oyj has a lower P/E than the average (19.8) P/E for companies in the capital markets industry.
This suggests that market participants think Evli Pankki Oyj will underperform other companies in its industry. While current expectations are low, the stock could be undervalued if the situation is better than the market assumes. It is arguably worth checking if insiders are buying shares, because that might imply they believe the stock is undervalued.
How Growth Rates Impact P/E Ratios
When earnings fall, the 'E' decreases, over time. That means even if the current P/E is low, it will increase over time if the share price stays flat. So while a stock may look cheap based on past earnings, it could be expensive based on future earnings.
Evli Pankki Oyj saw earnings per share decrease by 30% last year. And it has shrunk its earnings per share by 16% per year over the last five years. This might lead to muted expectations.
A Limitation: P/E Ratios Ignore Debt and Cash In The Bank
Don't forget that the P/E ratio considers market capitalization. That means it doesn't take debt or cash into account. The exact same company would hypothetically deserve a higher P/E ratio if it had a strong balance sheet, than if it had a weak one with lots of debt, because a cashed up company can spend on growth.
Such spending might be good or bad, overall, but the key point here is that you need to look at debt to understand the P/E ratio in context.
How Does Evli Pankki Oyj's Debt Impact Its P/E Ratio?
Net debt totals 83% of Evli Pankki Oyj's market cap. This is a reasonably significant level of debt -- all else being equal you'd expect a much lower P/E than if it had net cash.
The Bottom Line On Evli Pankki Oyj's P/E Ratio
Evli Pankki Oyj's P/E is 15.0 which is below average (20.1) in the FI market. The P/E reflects market pessimism that probably arises from the lack of recent EPS growth, paired with significant leverage.
When the market is wrong about a stock, it gives savvy investors an opportunity. If it is underestimating a company, investors can make money by buying and holding the shares until the market corrects itself. So this free visualization of the analyst consensus on future earnings could help you make the right decision about whether to buy, sell, or hold.
You might be able to find a better buy than Evli Pankki Oyj. If you want a selection of possible winners, check out this free list of interesting companies that trade on a P/E below 20 (but have proven they can grow earnings).
We aim to bring you long-term focused research analysis driven by fundamental data. Note that our analysis may not factor in the latest price-sensitive company announcements or qualitative material.
If you spot an error that warrants correction, please contact the editor at editorial-team@simplywallst.com. This article by Simply Wall St is general in nature. It does not constitute a recommendation to buy or sell any stock, and does not take account of your objectives, or your financial situation. Simply Wall St has no position in the stocks mentioned. Thank you for reading.
