
 Yahoo Finance
 Does Experian plc’s (LON:EXPN) ROCE Reflect Well On The Business?

Today we are going to look at Experian plc (LON:EXPN) to see whether it might be an attractive investment prospect. Specifically, we're going to calculate its Return On Capital Employed (ROCE), in the hopes of getting some insight into the business.
First, we'll go over how we calculate ROCE. Second, we'll look at its ROCE compared to similar companies. Finally, we'll look at how its current liabilities affect its ROCE.
Return On Capital Employed (ROCE): What is it?
ROCE measures the amount of pre-tax profits a company can generate from the capital employed in its business. In general, businesses with a higher ROCE are usually better quality. Overall, it is a valuable metric that has its flaws. Renowned investment researcher Michael Mauboussin has suggested that a high ROCE can indicate that 'one dollar invested in the company generates value of more than one dollar'.
So, How Do We Calculate ROCE?
The formula for calculating the return on capital employed is:
Return on Capital Employed = Earnings Before Interest and Tax (EBIT) ÷ (Total Assets - Current Liabilities)
Or for Experian:
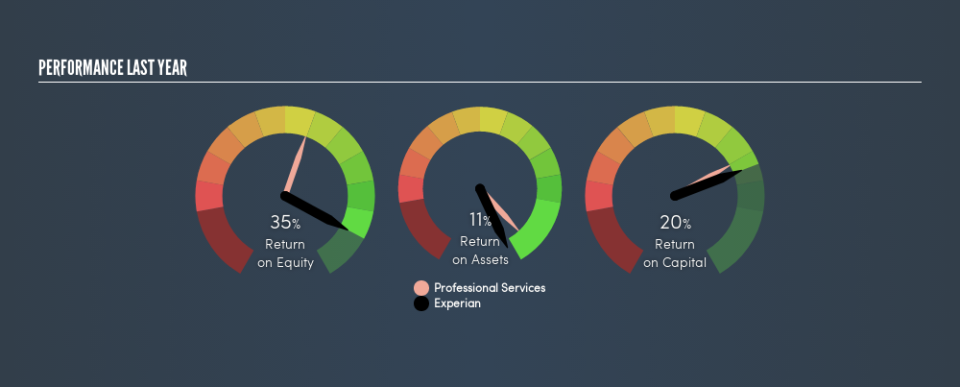
0.20 = US$1.1b ÷ (US$7.9b - US$2.3b) (Based on the trailing twelve months to September 2018.)
So, Experian has an ROCE of 20%.
Check out our latest analysis for Experian
Does Experian Have A Good ROCE?
ROCE can be useful when making comparisons, such as between similar companies. We can see Experian's ROCE is around the 20% average reported by the Professional Services industry. Regardless of the industry comparison, in absolute terms, Experian's ROCE currently appears to be excellent.
It is important to remember that ROCE shows past performance, and is not necessarily predictive. ROCE can be deceptive for cyclical businesses, as returns can look incredible in boom times, and terribly low in downturns. ROCE is only a point-in-time measure. Future performance is what matters, and you can see analyst predictions in our free report on analyst forecasts for the company.
What Are Current Liabilities, And How Do They Affect Experian's ROCE?
Current liabilities are short term bills and invoices that need to be paid in 12 months or less. The ROCE equation subtracts current liabilities from capital employed, so a company with a lot of current liabilities appears to have less capital employed, and a higher ROCE than otherwise. To check the impact of this, we calculate if a company has high current liabilities relative to its total assets.
Experian has total assets of US$7.9b and current liabilities of US$2.3b. As a result, its current liabilities are equal to approximately 29% of its total assets. The fairly low level of current liabilities won't have much impact on the already great ROCE.
The Bottom Line On Experian's ROCE
Low current liabilities and high ROCE is a good combination, making Experian look quite interesting. Experian looks strong on this analysis, but there are plenty of other companies that could be a good opportunity . Here is a free list of companies growing earnings rapidly.
If you like to buy stocks alongside management, then you might just love this free list of companies. (Hint: insiders have been buying them).
We aim to bring you long-term focused research analysis driven by fundamental data. Note that our analysis may not factor in the latest price-sensitive company announcements or qualitative material.
If you spot an error that warrants correction, please contact the editor at editorial-team@simplywallst.com. This article by Simply Wall St is general in nature. It does not constitute a recommendation to buy or sell any stock, and does not take account of your objectives, or your financial situation. Simply Wall St has no position in the stocks mentioned. Thank you for reading.
