
 Yahoo Finance
 Does Experian plc's (LON:EXPN) -15% Earnings Drop Reflect A Longer Term Trend?

For investors, increase in profitability and industry-beating performance can be essential considerations in an investment. Below, I will examine Experian plc's (LSE:EXPN) track record on a high level, to give you some insight into how the company has been performing against its long term trend and its industry peers.
View our latest analysis for Experian
Was EXPN weak performance lately part of a long-term decline?
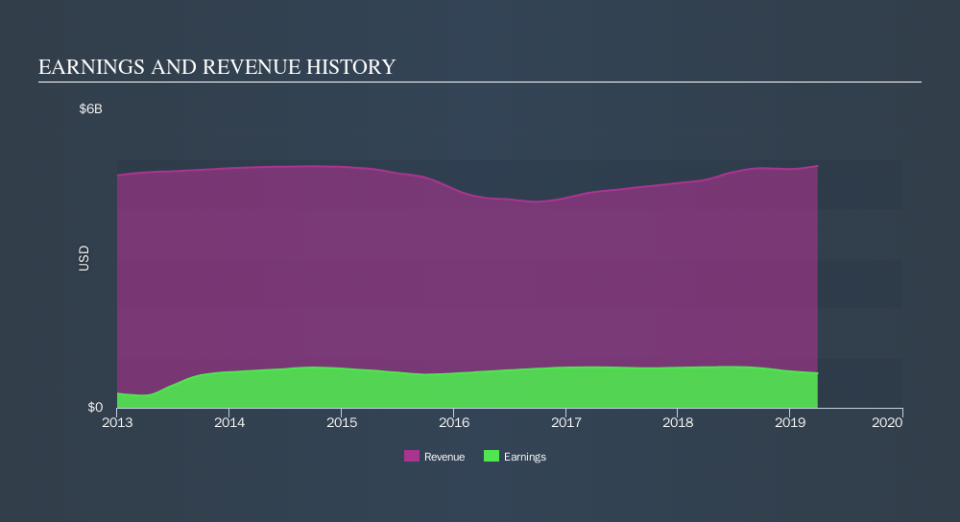
EXPN's trailing twelve-month earnings (from 31 March 2019) of US$695m has declined by -15% compared to the previous year.
Furthermore, this one-year growth rate has been lower than its average earnings growth rate over the past 5 years of 0.8%, indicating the rate at which EXPN is growing has slowed down. What could be happening here? Well, let's look at what's transpiring with margins and whether the whole industry is feeling the heat.
In terms of returns from investment, Experian has invested its equity funds well leading to a 28% return on equity (ROE), above the sensible minimum of 20%. Furthermore, its return on assets (ROA) of 10% exceeds the GB Professional Services industry of 7.9%, indicating Experian has used its assets more efficiently. And finally, its return on capital (ROC), which also accounts for Experian’s debt level, has increased over the past 3 years from 17% to 23%.
What does this mean?
Though Experian's past data is helpful, it is only one aspect of my investment thesis. In some cases, companies that experience a prolonged period of decline in earnings are undergoing some sort of reinvestment phase in order to keep up with the latest industry growth and disruption. You should continue to research Experian to get a better picture of the stock by looking at:
Future Outlook: What are well-informed industry analysts predicting for EXPN’s future growth? Take a look at our free research report of analyst consensus for EXPN’s outlook.
Financial Health: Are EXPN’s operations financially sustainable? Balance sheets can be hard to analyze, which is why we’ve done it for you. Check out our financial health checks here.
Other High-Performing Stocks: Are there other stocks that provide better prospects with proven track records? Explore our free list of these great stocks here.
NB: Figures in this article are calculated using data from the trailing twelve months from 31 March 2019. This may not be consistent with full year annual report figures.
We aim to bring you long-term focused research analysis driven by fundamental data. Note that our analysis may not factor in the latest price-sensitive company announcements or qualitative material.
If you spot an error that warrants correction, please contact the editor at editorial-team@simplywallst.com. This article by Simply Wall St is general in nature. It does not constitute a recommendation to buy or sell any stock, and does not take account of your objectives, or your financial situation. Simply Wall St has no position in the stocks mentioned. Thank you for reading.
