
 Yahoo Finance
 How Does FBL Financial Group's (NYSE:FFG) P/E Compare To Its Industry, After The Share Price Drop?

Unfortunately for some shareholders, the FBL Financial Group (NYSE:FFG) share price has dived 32% in the last thirty days. Indeed the recent decline has arguably caused some bitterness for shareholders who have held through the 42% drop over twelve months.
Assuming nothing else has changed, a lower share price makes a stock more attractive to potential buyers. In the long term, share prices tend to follow earnings per share, but in the short term prices bounce around in response to short term factors (which are not always obvious). The implication here is that long term investors have an opportunity when expectations of a company are too low. One way to gauge market expectations of a stock is to look at its Price to Earnings Ratio (PE Ratio). A high P/E implies that investors have high expectations of what a company can achieve compared to a company with a low P/E ratio.
See our latest analysis for FBL Financial Group
Does FBL Financial Group Have A Relatively High Or Low P/E For Its Industry?
FBL Financial Group's P/E of 7.74 indicates relatively low sentiment towards the stock. We can see in the image below that the average P/E (10.5) for companies in the insurance industry is higher than FBL Financial Group's P/E.
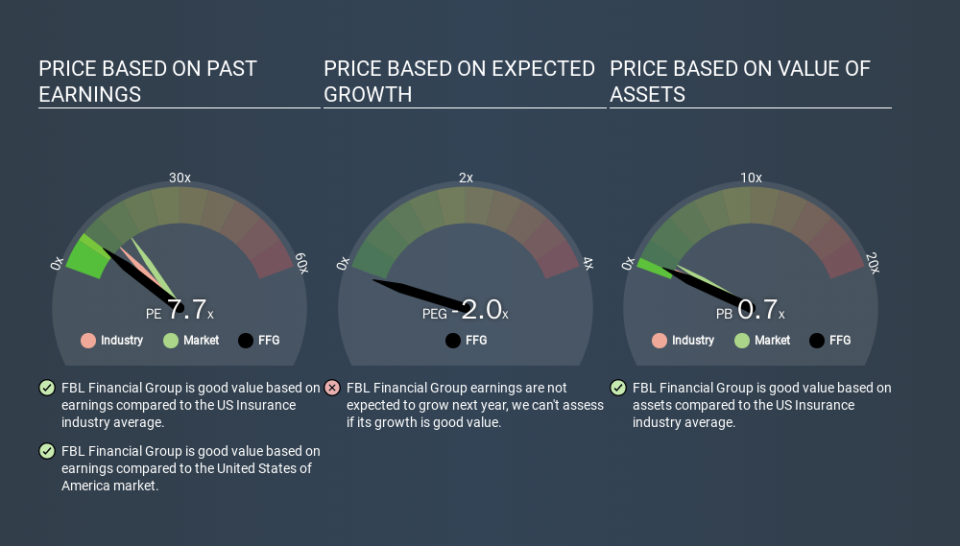
FBL Financial Group's P/E tells us that market participants think it will not fare as well as its peers in the same industry. Since the market seems unimpressed with FBL Financial Group, it's quite possible it could surprise on the upside. You should delve deeper. I like to check if company insiders have been buying or selling.
How Growth Rates Impact P/E Ratios
P/E ratios primarily reflect market expectations around earnings growth rates. That's because companies that grow earnings per share quickly will rapidly increase the 'E' in the equation. Therefore, even if you pay a high multiple of earnings now, that multiple will become lower in the future. And as that P/E ratio drops, the company will look cheap, unless its share price increases.
FBL Financial Group increased earnings per share by a whopping 36% last year. And its annual EPS growth rate over 5 years is 2.9%. I'd therefore be a little surprised if its P/E ratio was not relatively high.
Don't Forget: The P/E Does Not Account For Debt or Bank Deposits
Don't forget that the P/E ratio considers market capitalization. So it won't reflect the advantage of cash, or disadvantage of debt. Hypothetically, a company could reduce its future P/E ratio by spending its cash (or taking on debt) to achieve higher earnings.
Spending on growth might be good or bad a few years later, but the point is that the P/E ratio does not account for the option (or lack thereof).
How Does FBL Financial Group's Debt Impact Its P/E Ratio?
FBL Financial Group has net debt worth just 7.0% of its market capitalization. So it doesn't have as many options as it would with net cash, but its debt would not have much of an impact on its P/E ratio.
The Verdict On FBL Financial Group's P/E Ratio
FBL Financial Group has a P/E of 7.7. That's below the average in the US market, which is 14.7. The company does have a little debt, and EPS growth was good last year. If it continues to grow, then the current low P/E may prove to be unjustified. Given FBL Financial Group's P/E ratio has declined from 11.4 to 7.7 in the last month, we know for sure that the market is more worried about the business today, than it was back then. For those who prefer invest in growth, this stock apparently offers limited promise, but the deep value investors may find the pessimism around this stock enticing.
Investors have an opportunity when market expectations about a stock are wrong. If the reality for a company is not as bad as the P/E ratio indicates, then the share price should increase as the market realizes this. So this free report on the analyst consensus forecasts could help you make a master move on this stock.
Of course, you might find a fantastic investment by looking at a few good candidates. So take a peek at this free list of companies with modest (or no) debt, trading on a P/E below 20.
If you spot an error that warrants correction, please contact the editor at editorial-team@simplywallst.com. This article by Simply Wall St is general in nature. It does not constitute a recommendation to buy or sell any stock, and does not take account of your objectives, or your financial situation. Simply Wall St has no position in the stocks mentioned.
We aim to bring you long-term focused research analysis driven by fundamental data. Note that our analysis may not factor in the latest price-sensitive company announcements or qualitative material. Thank you for reading.