
 Yahoo Finance
 Does Forbidden Technologies plc (LON:FBT) Fall With The Market?

For Forbidden Technologies plc’s (AIM:FBT) shareholders, and also potential investors in the stock, understanding how the stock’s risk and return characteristics can impact your portfolio is important. FBT is exposed to market-wide risk, which arises from investing in the stock market. This risk reflects changes in economic and political factors that affects all stocks, and is measured by its beta. Not all stocks are expose to the same level of market risk, and the market as a whole represents a beta value of one. A stock with a beta greater than one is expected to exhibit higher volatility resulting from market-wide shocks compared to one with a beta below one.
See our latest analysis for Forbidden Technologies
An interpretation of FBT’s beta
Forbidden Technologies’s beta of 0.63 indicates that the company is less volatile relative to the diversified market portfolio. The stock will exhibit muted movements in both the downside and upside, in response to changing economic conditions, whereas the general market may move by a lot more. Based on this beta value, FBT appears to be a stock that an investor with a high-beta portfolio would look for to reduce risk exposure to the market.
Does FBT’s size and industry impact the expected beta?
FBT, with its market capitalisation of UK£9.75M, is a small-cap stock, which generally have higher beta than similar companies of larger size. Moreover, FBT’s industry, software, is considered to be cyclical, which means it is more volatile than the market over the economic cycle. Therefore, investors may expect high beta associated with small companies, as well as those operating in the software industry, relative to those more well-established firms in a more defensive industry. This is an interesting conclusion, since both FBT’s size and industry indicates the stock should have a higher beta than it currently has. A potential driver of this variance can be a fundamental factor, which we will take a look at next.
Can FBT’s asset-composition point to a higher beta?
An asset-heavy company tends to have a higher beta because the risk associated with running fixed assets during a downturn is highly expensive. I test FBT’s ratio of fixed assets to total assets in order to determine how high the risk is associated with this type of constraint. Considering fixed assets account for less than a third of the company’s overall assets, FBT seems to have a smaller dependency on fixed costs to generate revenue. As a result, the company may be less volatile relative to broad market movements, compared to a company of similar size but higher proportion of fixed assets. Similarly, FBT’s beta value conveys the same message.
What this means for you:
You could benefit from lower risk during times of economic decline by holding onto FBT. Its low fixed cost also means that, in terms of operating leverage, it is relatively flexible during times of economic downturns. What I have not mentioned in my article here are important company-specific fundamentals such as Forbidden Technologies’s financial health and performance track record. I highly recommend you to complete your research by taking a look at the following:
Financial Health: Is FBT’s operations financially sustainable? Balance sheets can be hard to analyze, which is why we’ve done it for you. Check out our financial health checks here.
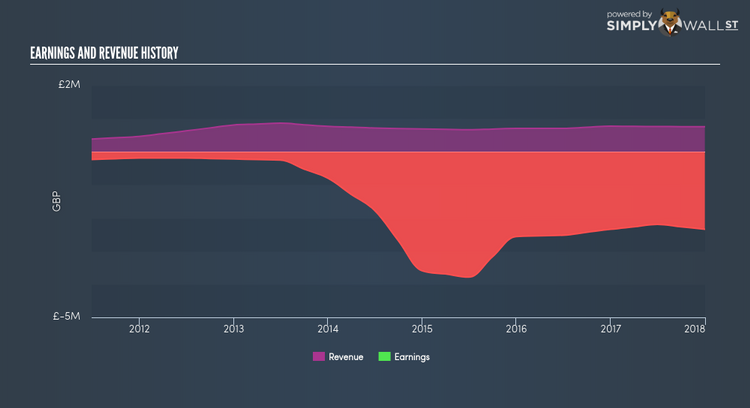
Past Track Record: Has FBT been consistently performing well irrespective of the ups and downs in the market? Go into more detail in the past performance analysis and take a look at the free visual representations of FBT’s historicals for more clarity.
Other High-Performing Stocks: Are there other stocks that provide better prospects with proven track records? Explore our free list of these great stocks here.
To help readers see pass the short term volatility of the financial market, we aim to bring you a long-term focused research analysis purely driven by fundamental data. Note that our analysis does not factor in the latest price sensitive company announcements.
The author is an independent contributor and at the time of publication had no position in the stocks mentioned.