
 Yahoo Finance
 Does FW Thorpe Plc (LON:TFW) Have A Good P/E Ratio?

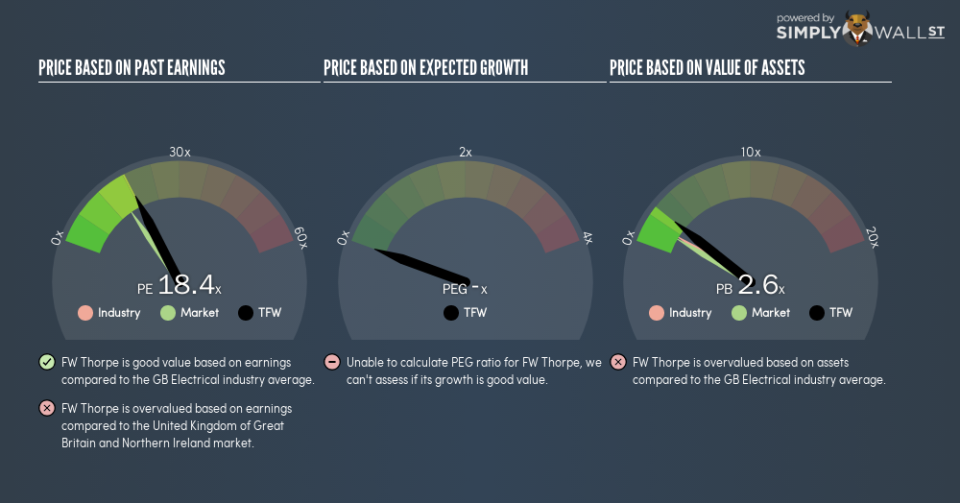
This article is written for those who want to get better at using price to earnings ratios (P/E ratios). To keep it practical, we’ll show how FW Thorpe Plc’s (LON:TFW) P/E ratio could help you assess the value on offer. Based on the last twelve months, FW Thorpe’s P/E ratio is 18.41. That is equivalent to an earnings yield of about 5.4%.
See our latest analysis for FW Thorpe
How Do I Calculate A Price To Earnings Ratio?
The formula for P/E is:
Price to Earnings Ratio = Price per Share ÷ Earnings per Share (EPS)
Or for FW Thorpe:
P/E of 18.41 = £2.56 ÷ £0.14 (Based on the trailing twelve months to June 2018.)
Is A High P/E Ratio Good?
A higher P/E ratio means that buyers have to pay a higher price for each £1 the company has earned over the last year. All else being equal, it’s better to pay a low price — but as Warren Buffett said, ‘It’s far better to buy a wonderful company at a fair price than a fair company at a wonderful price.’
How Growth Rates Impact P/E Ratios
Earnings growth rates have a big influence on P/E ratios. Earnings growth means that in the future the ‘E’ will be higher. That means unless the share price increases, the P/E will reduce in a few years. So while a stock may look expensive based on past earnings, it could be cheap based on future earnings.
It’s great to see that FW Thorpe grew EPS by 11% in the last year. And its annual EPS growth rate over 5 years is 11%. This could arguably justify a relatively high P/E ratio.
How Does FW Thorpe’s P/E Ratio Compare To Its Peers?
The P/E ratio essentially measures market expectations of a company. You can see in the image below that the average P/E (18.8) for companies in the electrical industry is roughly the same as FW Thorpe’s P/E.
FW Thorpe’s P/E tells us that market participants think its prospects are roughly in line with its industry. So if FW Thorpe actually outperforms its peers going forward, that should be a positive for the share price. Checking factors such as the tenure of the board and management could help you form your own view on if that will happen.
A Limitation: P/E Ratios Ignore Debt and Cash In The Bank
It’s important to note that the P/E ratio considers the market capitalization, not the enterprise value. That means it doesn’t take debt or cash into account. Hypothetically, a company could reduce its future P/E ratio by spending its cash (or taking on debt) to achieve higher earnings.
Such spending might be good or bad, overall, but the key point here is that you need to look at debt to understand the P/E ratio in context.
How Does FW Thorpe’s Debt Impact Its P/E Ratio?
The extra options and safety that comes with FW Thorpe’s UK£42m net cash position means that it deserves a higher P/E than it would if it had a lot of net debt.
The Bottom Line On FW Thorpe’s P/E Ratio
FW Thorpe trades on a P/E ratio of 18.4, which is above the GB market average of 15.4. With cash in the bank the company has plenty of growth options — and it is already on the right track. So it does not seem strange that the P/E is above average.
When the market is wrong about a stock, it gives savvy investors an opportunity. People often underestimate remarkable growth — so investors can make money when fast growth is not fully appreciated. Although we don’t have analyst forecasts, you could get a better understanding of its growth by checking out this more detailed historical graph of earnings, revenue and cash flow.
Of course you might be able to find a better stock than FW Thorpe. So you may wish to see this free collection of other companies that have grown earnings strongly.
To help readers see past the short term volatility of the financial market, we aim to bring you a long-term focused research analysis purely driven by fundamental data. Note that our analysis does not factor in the latest price-sensitive company announcements.
The author is an independent contributor and at the time of publication had no position in the stocks mentioned. For errors that warrant correction please contact the editor at editorial-team@simplywallst.com.
