
 Yahoo Finance
 How Does G-III Apparel Group's (NASDAQ:GIII) P/E Compare To Its Industry, After Its Big Share Price Gain?

G-III Apparel Group (NASDAQ:GIII) shareholders are no doubt pleased to see that the share price has bounced 30% in the last month alone, although it is still down 15% over the last quarter. But shareholders may not all be feeling jubilant, since the share price is still down 39% in the last year.
All else being equal, a sharp share price increase should make a stock less attractive to potential investors. In the long term, share prices tend to follow earnings per share, but in the short term prices bounce around in response to short term factors (which are not always obvious). The implication here is that deep value investors might steer clear when expectations of a company are too high. Perhaps the simplest way to get a read on investors' expectations of a business is to look at its Price to Earnings Ratio (PE Ratio). Investors have optimistic expectations of companies with higher P/E ratios, compared to companies with lower P/E ratios.
Check out our latest analysis for G-III Apparel Group
How Does G-III Apparel Group's P/E Ratio Compare To Its Peers?
G-III Apparel Group's P/E of 8.49 indicates relatively low sentiment towards the stock. The image below shows that G-III Apparel Group has a lower P/E than the average (16.7) P/E for companies in the luxury industry.
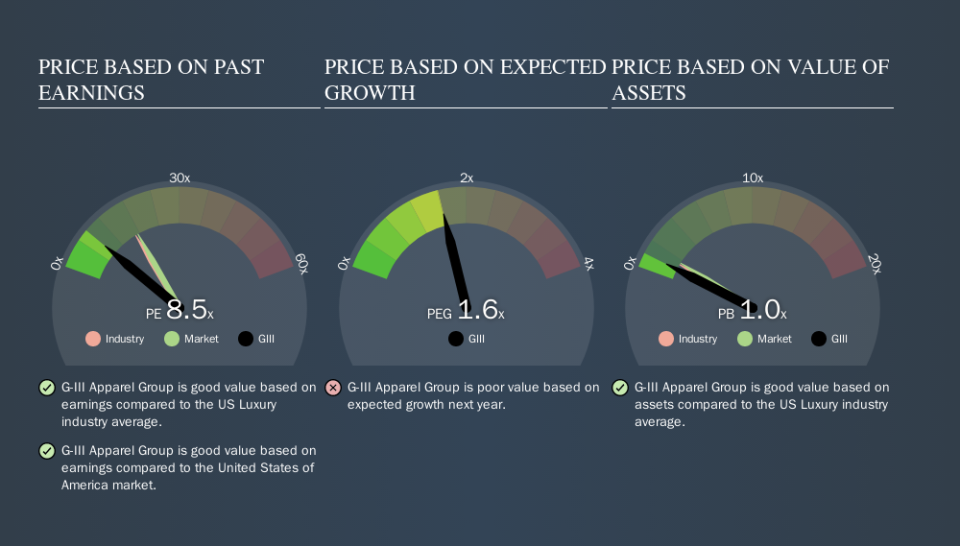
This suggests that market participants think G-III Apparel Group will underperform other companies in its industry. Since the market seems unimpressed with G-III Apparel Group, it's quite possible it could surprise on the upside. If you consider the stock interesting, further research is recommended. For example, I often monitor director buying and selling.
How Growth Rates Impact P/E Ratios
P/E ratios primarily reflect market expectations around earnings growth rates. Earnings growth means that in the future the 'E' will be higher. Therefore, even if you pay a high multiple of earnings now, that multiple will become lower in the future. And as that P/E ratio drops, the company will look cheap, unless its share price increases.
Notably, G-III Apparel Group grew EPS by a whopping 40% in the last year. And it has bolstered its earnings per share by 8.3% per year over the last five years. I'd therefore be a little surprised if its P/E ratio was not relatively high.
Remember: P/E Ratios Don't Consider The Balance Sheet
Don't forget that the P/E ratio considers market capitalization. So it won't reflect the advantage of cash, or disadvantage of debt. Hypothetically, a company could reduce its future P/E ratio by spending its cash (or taking on debt) to achieve higher earnings.
While growth expenditure doesn't always pay off, the point is that it is a good option to have; but one that the P/E ratio ignores.
How Does G-III Apparel Group's Debt Impact Its P/E Ratio?
G-III Apparel Group has net debt equal to 44% of its market cap. While it's worth keeping this in mind, it isn't a worry.
The Verdict On G-III Apparel Group's P/E Ratio
G-III Apparel Group has a P/E of 8.5. That's below the average in the US market, which is 17.4. The company hasn't stretched its balance sheet, and earnings growth was good last year. If it continues to grow, then the current low P/E may prove to be unjustified. What we know for sure is that investors are becoming less uncomfortable about G-III Apparel Group's prospects, since they have pushed its P/E ratio from 6.5 to 8.5 over the last month. If you like to buy stocks that could be turnaround opportunities, then this one might be a candidate; but if you're more sensitive to price, then you may feel the opportunity has passed.
Investors have an opportunity when market expectations about a stock are wrong. As value investor Benjamin Graham famously said, 'In the short run, the market is a voting machine but in the long run, it is a weighing machine. So this free report on the analyst consensus forecasts could help you make a master move on this stock.
Of course, you might find a fantastic investment by looking at a few good candidates. So take a peek at this free list of companies with modest (or no) debt, trading on a P/E below 20.
We aim to bring you long-term focused research analysis driven by fundamental data. Note that our analysis may not factor in the latest price-sensitive company announcements or qualitative material.
If you spot an error that warrants correction, please contact the editor at editorial-team@simplywallst.com. This article by Simply Wall St is general in nature. It does not constitute a recommendation to buy or sell any stock, and does not take account of your objectives, or your financial situation. Simply Wall St has no position in the stocks mentioned. Thank you for reading.
