
 Yahoo Finance
 Does The Gap, Inc. (NYSE:GPS) Create Value For Shareholders?

Today we are going to look at The Gap, Inc. (NYSE:GPS) to see whether it might be an attractive investment prospect. To be precise, we'll consider its Return On Capital Employed (ROCE), as that will inform our view of the quality of the business.
First up, we'll look at what ROCE is and how we calculate it. Second, we'll look at its ROCE compared to similar companies. Last but not least, we'll look at what impact its current liabilities have on its ROCE.
Return On Capital Employed (ROCE): What is it?
ROCE measures the amount of pre-tax profits a company can generate from the capital employed in its business. In general, businesses with a higher ROCE are usually better quality. Ultimately, it is a useful but imperfect metric. Renowned investment researcher Michael Mauboussin has suggested that a high ROCE can indicate that 'one dollar invested in the company generates value of more than one dollar'.
So, How Do We Calculate ROCE?
The formula for calculating the return on capital employed is:
Return on Capital Employed = Earnings Before Interest and Tax (EBIT) ÷ (Total Assets - Current Liabilities)
Or for Gap:
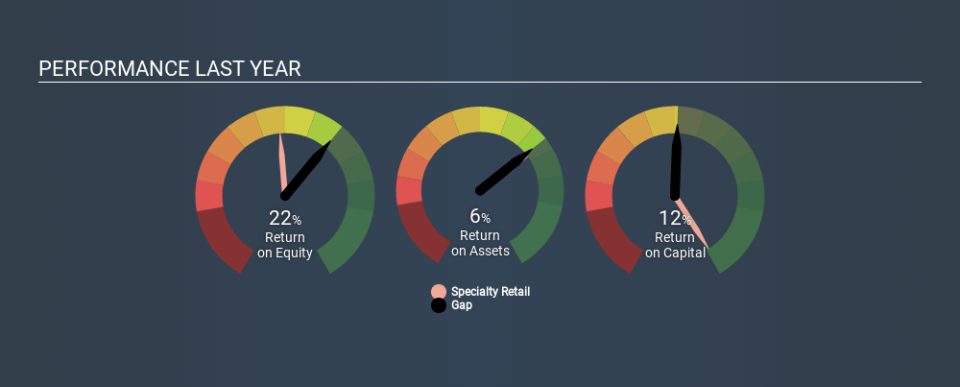
0.12 = US$1.3b ÷ (US$14b - US$3.2b) (Based on the trailing twelve months to November 2019.)
So, Gap has an ROCE of 12%.
Check out our latest analysis for Gap
Does Gap Have A Good ROCE?
One way to assess ROCE is to compare similar companies. Using our data, Gap's ROCE appears to be around the 11% average of the Specialty Retail industry. Separate from Gap's performance relative to its industry, its ROCE in absolute terms looks satisfactory, and it may be worth researching in more depth.
Gap's current ROCE of 12% is lower than its ROCE in the past, which was 30%, 3 years ago. So investors might consider if it has had issues recently. You can see in the image below how Gap's ROCE compares to its industry. Click to see more on past growth.
It is important to remember that ROCE shows past performance, and is not necessarily predictive. ROCE can be deceptive for cyclical businesses, as returns can look incredible in boom times, and terribly low in downturns. ROCE is, after all, simply a snap shot of a single year. What happens in the future is pretty important for investors, so we have prepared a free report on analyst forecasts for Gap.
How Gap's Current Liabilities Impact Its ROCE
Current liabilities are short term bills and invoices that need to be paid in 12 months or less. Due to the way the ROCE equation works, having large bills due in the near term can make it look as though a company has less capital employed, and thus a higher ROCE than usual. To counter this, investors can check if a company has high current liabilities relative to total assets.
Gap has total assets of US$14b and current liabilities of US$3.2b. As a result, its current liabilities are equal to approximately 23% of its total assets. Low current liabilities are not boosting the ROCE too much.
What We Can Learn From Gap's ROCE
With that in mind, Gap's ROCE appears pretty good. Gap shapes up well under this analysis, but it is far from the only business delivering excellent numbers . You might also want to check this free collection of companies delivering excellent earnings growth.
For those who like to find winning investments this free list of growing companies with recent insider purchasing, could be just the ticket.
If you spot an error that warrants correction, please contact the editor at editorial-team@simplywallst.com. This article by Simply Wall St is general in nature. It does not constitute a recommendation to buy or sell any stock, and does not take account of your objectives, or your financial situation. Simply Wall St has no position in the stocks mentioned.
We aim to bring you long-term focused research analysis driven by fundamental data. Note that our analysis may not factor in the latest price-sensitive company announcements or qualitative material. Thank you for reading.
