
 Yahoo Finance
 What Does Glory Sun Financial Group Limited's (HKG:1282) P/E Ratio Tell You?

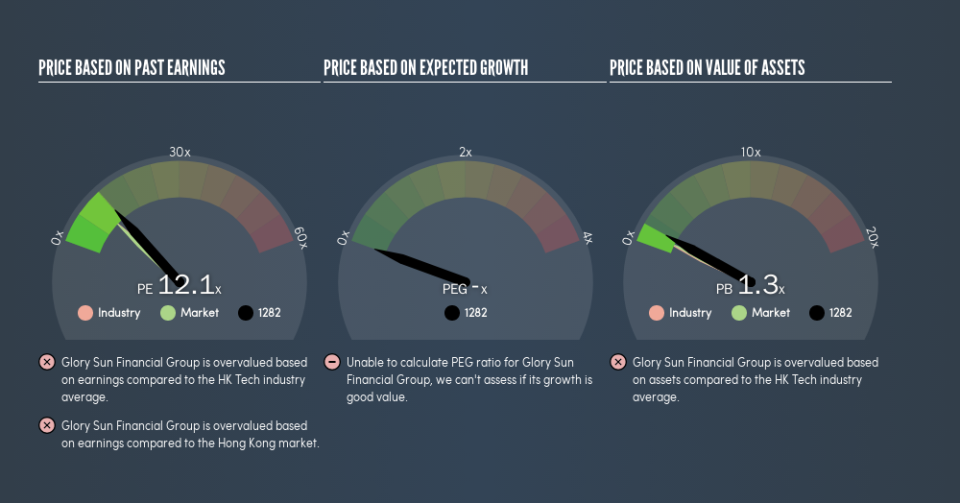
This article is for investors who would like to improve their understanding of price to earnings ratios (P/E ratios). We'll look at Glory Sun Financial Group Limited's (HKG:1282) P/E ratio and reflect on what it tells us about the company's share price. Looking at earnings over the last twelve months, Glory Sun Financial Group has a P/E ratio of 12.12. That means that at current prices, buyers pay HK$12.12 for every HK$1 in trailing yearly profits.
Check out our latest analysis for Glory Sun Financial Group
How Do I Calculate A Price To Earnings Ratio?
The formula for P/E is:
Price to Earnings Ratio = Share Price ÷ Earnings per Share (EPS)
Or for Glory Sun Financial Group:
P/E of 12.12 = HK$0.32 ÷ HK$0.026 (Based on the trailing twelve months to December 2018.)
Is A High Price-to-Earnings Ratio Good?
A higher P/E ratio implies that investors pay a higher price for the earning power of the business. That is not a good or a bad thing per se, but a high P/E does imply buyers are optimistic about the future.
Does Glory Sun Financial Group Have A Relatively High Or Low P/E For Its Industry?
One good way to get a quick read on what market participants expect of a company is to look at its P/E ratio. You can see in the image below that the average P/E (10.1) for companies in the tech industry is lower than Glory Sun Financial Group's P/E.
Its relatively high P/E ratio indicates that Glory Sun Financial Group shareholders think it will perform better than other companies in its industry classification. Shareholders are clearly optimistic, but the future is always uncertain. So investors should always consider the P/E ratio alongside other factors, such as whether company directors have been buying shares.
How Growth Rates Impact P/E Ratios
Generally speaking the rate of earnings growth has a profound impact on a company's P/E multiple. That's because companies that grow earnings per share quickly will rapidly increase the 'E' in the equation. Therefore, even if you pay a high multiple of earnings now, that multiple will become lower in the future. And as that P/E ratio drops, the company will look cheap, unless its share price increases.
Glory Sun Financial Group's earnings per share fell by 33% in the last twelve months. But EPS is up 3.3% over the last 3 years. And it has shrunk its earnings per share by 10.0% per year over the last five years. This could justify a pessimistic P/E.
Remember: P/E Ratios Don't Consider The Balance Sheet
It's important to note that the P/E ratio considers the market capitalization, not the enterprise value. Thus, the metric does not reflect cash or debt held by the company. Hypothetically, a company could reduce its future P/E ratio by spending its cash (or taking on debt) to achieve higher earnings.
Spending on growth might be good or bad a few years later, but the point is that the P/E ratio does not account for the option (or lack thereof).
How Does Glory Sun Financial Group's Debt Impact Its P/E Ratio?
Since Glory Sun Financial Group holds net cash of HK$243m, it can spend on growth, justifying a higher P/E ratio than otherwise.
The Verdict On Glory Sun Financial Group's P/E Ratio
Glory Sun Financial Group trades on a P/E ratio of 12.1, which is above its market average of 9.9. The recent drop in earnings per share would make some investors cautious, but the net cash position means the company has time to improve: and the high P/E suggests the market thinks it will.
Investors have an opportunity when market expectations about a stock are wrong. As value investor Benjamin Graham famously said, 'In the short run, the market is a voting machine but in the long run, it is a weighing machine.' Although we don't have analyst forecasts, you might want to assess this data-rich visualization of earnings, revenue and cash flow.
Of course you might be able to find a better stock than Glory Sun Financial Group. So you may wish to see this free collection of other companies that have grown earnings strongly.
We aim to bring you long-term focused research analysis driven by fundamental data. Note that our analysis may not factor in the latest price-sensitive company announcements or qualitative material.
If you spot an error that warrants correction, please contact the editor at editorial-team@simplywallst.com. This article by Simply Wall St is general in nature. It does not constitute a recommendation to buy or sell any stock, and does not take account of your objectives, or your financial situation. Simply Wall St has no position in the stocks mentioned. Thank you for reading.
