
 Yahoo Finance
 Does GrafTech International Ltd. (NYSE:EAF) Have A Good P/E Ratio?

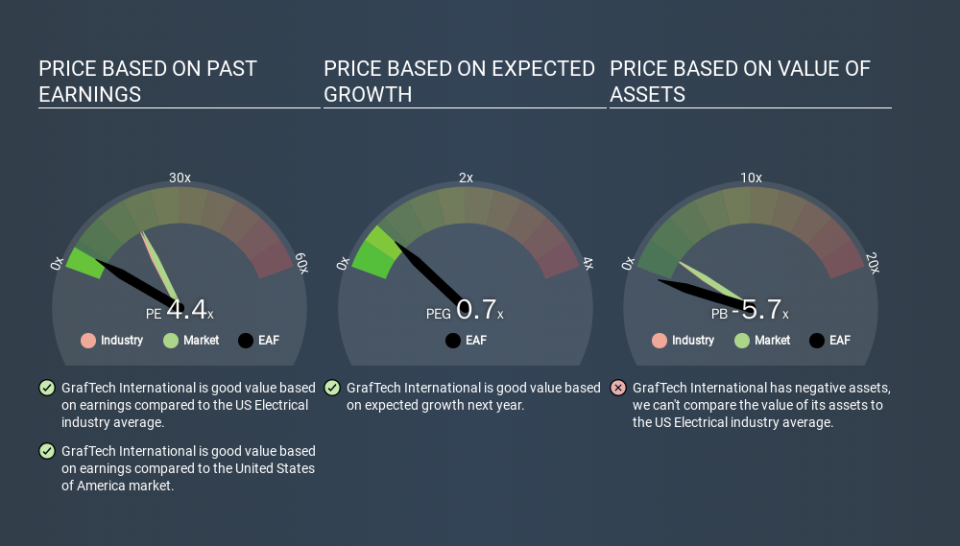
Today, we'll introduce the concept of the P/E ratio for those who are learning about investing. To keep it practical, we'll show how GrafTech International Ltd.'s (NYSE:EAF) P/E ratio could help you assess the value on offer. GrafTech International has a P/E ratio of 4.36, based on the last twelve months. In other words, at today's prices, investors are paying $4.36 for every $1 in prior year profit.
View our latest analysis for GrafTech International
How Do I Calculate A Price To Earnings Ratio?
The formula for price to earnings is:
Price to Earnings Ratio = Price per Share ÷ Earnings per Share (EPS)
Or for GrafTech International:
P/E of 4.36 = USD12.01 ÷ USD2.75 (Based on the trailing twelve months to September 2019.)
Is A High Price-to-Earnings Ratio Good?
The higher the P/E ratio, the higher the price tag of a business, relative to its trailing earnings. All else being equal, it's better to pay a low price -- but as Warren Buffett said, 'It's far better to buy a wonderful company at a fair price than a fair company at a wonderful price'.
Does GrafTech International Have A Relatively High Or Low P/E For Its Industry?
The P/E ratio essentially measures market expectations of a company. The image below shows that GrafTech International has a lower P/E than the average (18.4) P/E for companies in the electrical industry.
This suggests that market participants think GrafTech International will underperform other companies in its industry. Many investors like to buy stocks when the market is pessimistic about their prospects. You should delve deeper. I like to check if company insiders have been buying or selling.
How Growth Rates Impact P/E Ratios
P/E ratios primarily reflect market expectations around earnings growth rates. When earnings grow, the 'E' increases, over time. That means unless the share price increases, the P/E will reduce in a few years. Then, a lower P/E should attract more buyers, pushing the share price up.
GrafTech International increased earnings per share by an impressive 22% over the last twelve months.
A Limitation: P/E Ratios Ignore Debt and Cash In The Bank
One drawback of using a P/E ratio is that it considers market capitalization, but not the balance sheet. Thus, the metric does not reflect cash or debt held by the company. Theoretically, a business can improve its earnings (and produce a lower P/E in the future) by investing in growth. That means taking on debt (or spending its cash).
Such spending might be good or bad, overall, but the key point here is that you need to look at debt to understand the P/E ratio in context.
Is Debt Impacting GrafTech International's P/E?
GrafTech International has net debt equal to 48% of its market cap. While it's worth keeping this in mind, it isn't a worry.
The Verdict On GrafTech International's P/E Ratio
GrafTech International trades on a P/E ratio of 4.4, which is below the US market average of 19.0. The EPS growth last year was strong, and debt levels are quite reasonable. If the company can continue to grow earnings, then the current P/E may be unjustifiably low.
Investors should be looking to buy stocks that the market is wrong about. As value investor Benjamin Graham famously said, 'In the short run, the market is a voting machine but in the long run, it is a weighing machine. So this free report on the analyst consensus forecasts could help you make a master move on this stock.
You might be able to find a better buy than GrafTech International. If you want a selection of possible winners, check out this free list of interesting companies that trade on a P/E below 20 (but have proven they can grow earnings).
If you spot an error that warrants correction, please contact the editor at editorial-team@simplywallst.com. This article by Simply Wall St is general in nature. It does not constitute a recommendation to buy or sell any stock, and does not take account of your objectives, or your financial situation. Simply Wall St has no position in the stocks mentioned.
We aim to bring you long-term focused research analysis driven by fundamental data. Note that our analysis may not factor in the latest price-sensitive company announcements or qualitative material. Thank you for reading.
