
 Yahoo Finance
 How Does Grafton Group plc’s (LON:GFTU) Earnings Growth Stack Up Against Industry Performance?

Measuring Grafton Group plc’s (LSE:GFTU) track record of past performance is a valuable exercise for investors. It allows us to understand whether or not the company has met or exceed expectations, which is an insightful signal for future performance. Today I will assess GFTU’s recent performance announced on 31 December 2017 and compare these figures to its historical trend and industry movements. View our latest analysis for Grafton Group
Commentary On GFTU’s Past Performance
I use the ‘latest twelve-month’ data, which annualizes the most recent half-year data, or in some cases, the latest annual report is already the most recent financial year data. This method enables me to assess different companies on a more comparable basis, using the latest information. For Grafton Group, its latest earnings (trailing twelve month) is UK£127.72M, which compared to the previous year’s level, has increased by 36.82%. Since these values are fairly myopic, I’ve estimated an annualized five-year figure for Grafton Group’s earnings, which stands at UK£68.23M This means generally, Grafton Group has been able to steadily improve its bottom line over the past few years as well.
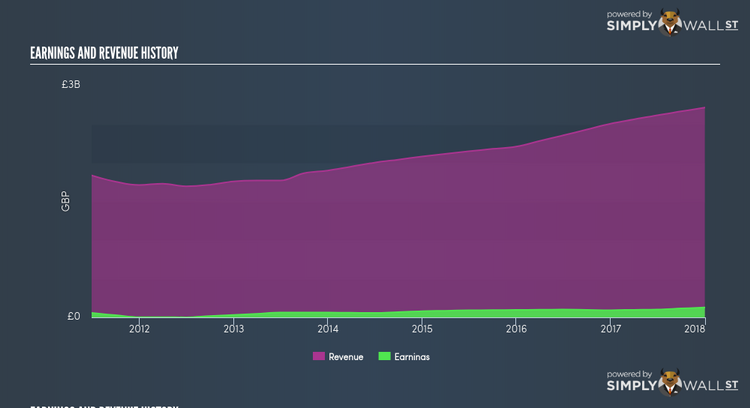
What’s enabled this growth? Well, let’s take a look at if it is merely owing to industry tailwinds, or if Grafton Group has seen some company-specific growth. In the past couple of years, Grafton Group increased its bottom line faster than revenue by efficiently controlling its costs. This brought about a margin expansion and profitability over time. Looking at growth from a sector-level, the UK trade distributors industry has been growing its average earnings by double-digit 16.77% over the previous twelve months, and 13.06% over the last five years. This shows that any tailwind the industry is gaining from, Grafton Group is capable of amplifying this to its advantage.
What does this mean?
Though Grafton Group’s past data is helpful, it is only one aspect of my investment thesis. Companies that have performed well in the past, such as Grafton Group gives investors conviction. However, the next step would be to assess whether the future looks as optimistic. I recommend you continue to research Grafton Group to get a better picture of the stock by looking at:
Future Outlook: What are well-informed industry analysts predicting for GFTU’s future growth? Take a look at our free research report of analyst consensus for GFTU’s outlook.
Financial Health: Is GFTU’s operations financially sustainable? Balance sheets can be hard to analyze, which is why we’ve done it for you. Check out our financial health checks here.
Other High-Performing Stocks: Are there other stocks that provide better prospects with proven track records? Explore our free list of these great stocks here.
NB: Figures in this article are calculated using data from the trailing twelve months from 31 December 2017. This may not be consistent with full year annual report figures.
To help readers see pass the short term volatility of the financial market, we aim to bring you a long-term focused research analysis purely driven by fundamental data. Note that our analysis does not factor in the latest price sensitive company announcements.
The author is an independent contributor and at the time of publication had no position in the stocks mentioned.
