
 Yahoo Finance
 Does Herman Miller's (NASDAQ:MLHR) Share Price Gain of 85% Match Its Business Performance?
Herman Miller, Inc. (NASDAQ:MLHR) shareholders might be concerned after seeing the share price drop 11% in the last week. But looking back over the last year, the returns have actually been rather pleasing! To wit, it had solidly beat the market, up 85%.
Check out our latest analysis for Herman Miller
While markets are a powerful pricing mechanism, share prices reflect investor sentiment, not just underlying business performance. One imperfect but simple way to consider how the market perception of a company has shifted is to compare the change in the earnings per share (EPS) with the share price movement.
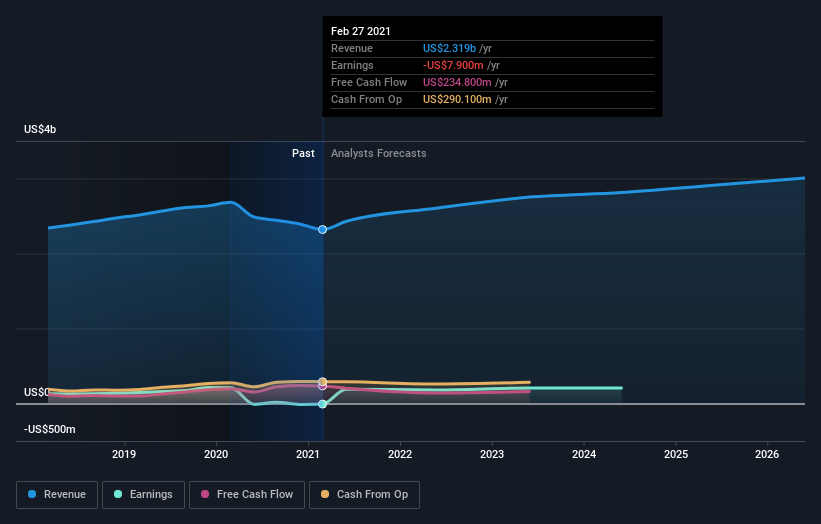
During the last year Herman Miller saw its earnings per share (EPS) drop below zero. While this may prove temporary, we'd consider it a negative, so we would not have expected to see the share price up. It may be that the company has done well on other metrics.
We are skeptical of the suggestion that the 1.7% dividend yield would entice buyers to the stock. Unfortunately Herman Miller's fell 13% over twelve months. So the fundamental metrics don't provide an obvious explanation for the share price gain.
You can see how earnings and revenue have changed over time in the image below (click on the chart to see the exact values).
We consider it positive that insiders have made significant purchases in the last year. Having said that, most people consider earnings and revenue growth trends to be a more meaningful guide to the business. This free report showing analyst forecasts should help you form a view on Herman Miller
What About Dividends?
As well as measuring the share price return, investors should also consider the total shareholder return (TSR). The TSR is a return calculation that accounts for the value of cash dividends (assuming that any dividend received was reinvested) and the calculated value of any discounted capital raisings and spin-offs. Arguably, the TSR gives a more comprehensive picture of the return generated by a stock. In the case of Herman Miller, it has a TSR of 88% for the last year. That exceeds its share price return that we previously mentioned. This is largely a result of its dividend payments!
A Different Perspective
It's nice to see that Herman Miller shareholders have received a total shareholder return of 88% over the last year. Of course, that includes the dividend. That gain is better than the annual TSR over five years, which is 11%. Therefore it seems like sentiment around the company has been positive lately. In the best case scenario, this may hint at some real business momentum, implying that now could be a great time to delve deeper. While it is well worth considering the different impacts that market conditions can have on the share price, there are other factors that are even more important. For example, we've discovered 1 warning sign for Herman Miller that you should be aware of before investing here.
Herman Miller is not the only stock insiders are buying. So take a peek at this free list of growing companies with insider buying.
Please note, the market returns quoted in this article reflect the market weighted average returns of stocks that currently trade on US exchanges.
This article by Simply Wall St is general in nature. It does not constitute a recommendation to buy or sell any stock, and does not take account of your objectives, or your financial situation. We aim to bring you long-term focused analysis driven by fundamental data. Note that our analysis may not factor in the latest price-sensitive company announcements or qualitative material. Simply Wall St has no position in any stocks mentioned.
Have feedback on this article? Concerned about the content? Get in touch with us directly. Alternatively, email editorial-team (at) simplywallst.com.
