
 Yahoo Finance
 Does The Hongkong and Shanghai Hotels Limited’s (HKG:45) Recent Track Record Look Strong?

Understanding The Hongkong and Shanghai Hotels Limited’s (HKG:45) performance as a company requires examining more than earnings from one point in time. Today I will take you through a basic sense check to gain perspective on how Hongkong and Shanghai Hotels is doing by evaluating its latest earnings with its longer term trend as well as its industry peers’ performance over the same period. See our latest analysis for Hongkong and Shanghai Hotels
Were 45’s earnings stronger than its past performances and the industry?
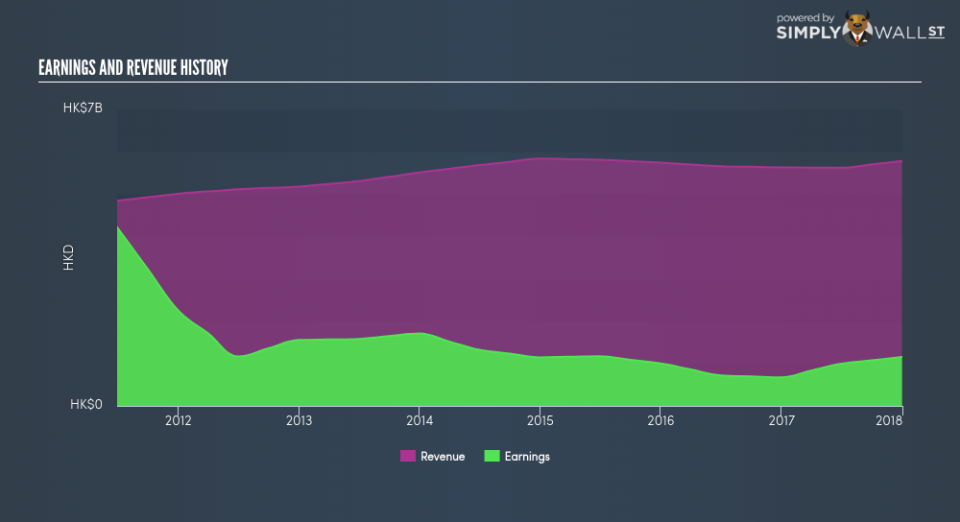
45’s trailing twelve-month earnings (from 31 December 2017) of HK$1.16b has jumped 71.11% compared to the previous year. Furthermore, this one-year growth rate has exceeded its 5-year annual growth average of -19.76%, indicating the rate at which 45 is growing has accelerated. How has it been able to do this? Well, let’s take a look at if it is only attributable to industry tailwinds, or if Hongkong and Shanghai Hotels has experienced some company-specific growth.
Over the past couple of years, Hongkong and Shanghai Hotels top-line expansion has overtaken earnings and the growth rate of expenses. Though this has led to a margin contraction, it has moderated Hongkong and Shanghai Hotels’s earnings contraction. Scanning growth from a sector-level, the HK hospitality industry has been growing its average earnings by double-digit 26.50% over the previous twelve months, . This is a turnaround from a volatile drop of -4.09% in the previous couple of years. This means in the recent industry expansion, Hongkong and Shanghai Hotels is able to leverage this to its advantage.
In terms of returns from investment, Hongkong and Shanghai Hotels has not invested its equity funds well, leading to a 2.98% return on equity (ROE), below the sensible minimum of 20%. Furthermore, its return on assets (ROA) of 2.56% is below the HK Hospitality industry of 3.85%, indicating Hongkong and Shanghai Hotels’s are utilized less efficiently. And finally, its return on capital (ROC), which also accounts for Hongkong and Shanghai Hotels’s debt level, has declined over the past 3 years from 2.38% to 1.63%. This correlates with an increase in debt holding, with debt-to-equity ratio rising from 12.75% to 19.24% over the past 5 years.
What does this mean?
While past data is useful, it doesn’t tell the whole story. Recent positive growth doesn’t necessarily mean it’s onwards and upwards for the company. There may be variables that are influencing the entire industry thus the high industry growth rate over the same time period. You should continue to research Hongkong and Shanghai Hotels to get a more holistic view of the stock by looking at:
Financial Health: Is 45’s operations financially sustainable? Balance sheets can be hard to analyze, which is why we’ve done it for you. Check out our financial health checks here.
Other High-Performing Stocks: Are there other stocks that provide better prospects with proven track records? Explore our free list of these great stocks here.
NB: Figures in this article are calculated using data from the trailing twelve months from 31 December 2017. This may not be consistent with full year annual report figures.
To help readers see pass the short term volatility of the financial market, we aim to bring you a long-term focused research analysis purely driven by fundamental data. Note that our analysis does not factor in the latest price sensitive company announcements.
The author is an independent contributor and at the time of publication had no position in the stocks mentioned.
