
 Yahoo Finance
 Does Hunter Douglas's (AMS:HDG) Share Price Gain of 74% Match Its Business Performance?

Stock pickers are generally looking for stocks that will outperform the broader market. And the truth is, you can make significant gains if you buy good quality businesses at the right price. For example, the Hunter Douglas N.V. (AMS:HDG) share price is up 74% in the last 5 years, clearly besting the market return of around 33% (ignoring dividends). However, more recent returns haven't been as impressive as that, with the stock returning just 5.8% in the last year , including dividends .
See our latest analysis for Hunter Douglas
In his essay The Superinvestors of Graham-and-Doddsville Warren Buffett described how share prices do not always rationally reflect the value of a business. By comparing earnings per share (EPS) and share price changes over time, we can get a feel for how investor attitudes to a company have morphed over time.
During five years of share price growth, Hunter Douglas achieved compound earnings per share (EPS) growth of 18% per year. This EPS growth is higher than the 12% average annual increase in the share price. So one could conclude that the broader market has become more cautious towards the stock. The reasonably low P/E ratio of 8.32 also suggests market apprehension.
You can see how EPS has changed over time in the image below (click on the chart to see the exact values).
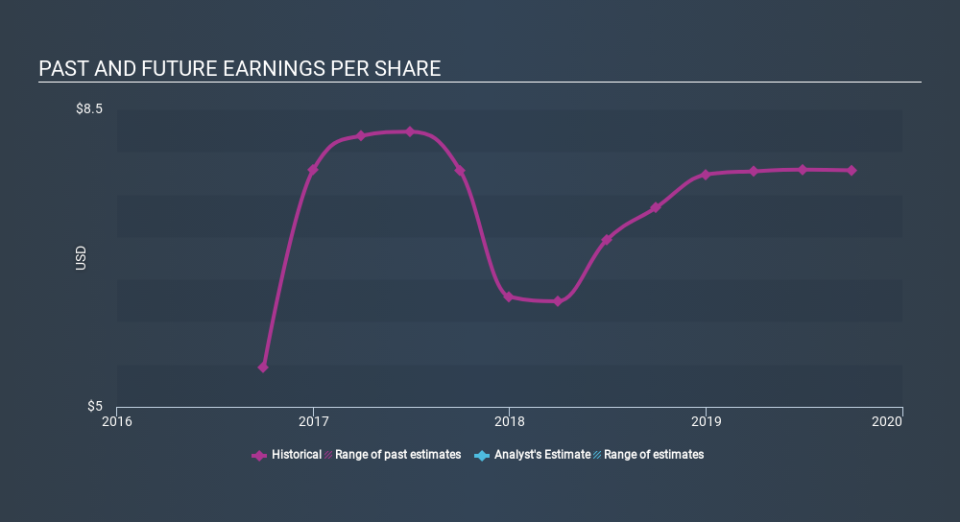
This free interactive report on Hunter Douglas's earnings, revenue and cash flow is a great place to start, if you want to investigate the stock further.
What About Dividends?
When looking at investment returns, it is important to consider the difference between total shareholder return (TSR) and share price return. Whereas the share price return only reflects the change in the share price, the TSR includes the value of dividends (assuming they were reinvested) and the benefit of any discounted capital raising or spin-off. So for companies that pay a generous dividend, the TSR is often a lot higher than the share price return. We note that for Hunter Douglas the TSR over the last 5 years was 102%, which is better than the share price return mentioned above. The dividends paid by the company have thusly boosted the total shareholder return.
A Different Perspective
Hunter Douglas provided a TSR of 5.8% over the last twelve months. Unfortunately this falls short of the market return. If we look back over five years, the returns are even better, coming in at 15% per year for five years. Maybe the share price is just taking a breather while the business executes on its growth strategy. Keeping this in mind, a solid next step might be to take a look at Hunter Douglas's dividend track record. This free interactive graph is a great place to start.
But note: Hunter Douglas may not be the best stock to buy. So take a peek at this free list of interesting companies with past earnings growth (and further growth forecast).
Please note, the market returns quoted in this article reflect the market weighted average returns of stocks that currently trade on NL exchanges.
If you spot an error that warrants correction, please contact the editor at editorial-team@simplywallst.com. This article by Simply Wall St is general in nature. It does not constitute a recommendation to buy or sell any stock, and does not take account of your objectives, or your financial situation. Simply Wall St has no position in the stocks mentioned.
We aim to bring you long-term focused research analysis driven by fundamental data. Note that our analysis may not factor in the latest price-sensitive company announcements or qualitative material. Thank you for reading.
