
 Yahoo Finance
 Does Illumina (NASDAQ:ILMN) Have A Healthy Balance Sheet?
Warren Buffett famously said, 'Volatility is far from synonymous with risk.' So it might be obvious that you need to consider debt, when you think about how risky any given stock is, because too much debt can sink a company. We note that Illumina, Inc. (NASDAQ:ILMN) does have debt on its balance sheet. But should shareholders be worried about its use of debt?
When Is Debt A Problem?
Debt assists a business until the business has trouble paying it off, either with new capital or with free cash flow. Part and parcel of capitalism is the process of 'creative destruction' where failed businesses are mercilessly liquidated by their bankers. However, a more usual (but still expensive) situation is where a company must dilute shareholders at a cheap share price simply to get debt under control. Of course, plenty of companies use debt to fund growth, without any negative consequences. When we think about a company's use of debt, we first look at cash and debt together.
See our latest analysis for Illumina
What Is Illumina's Debt?
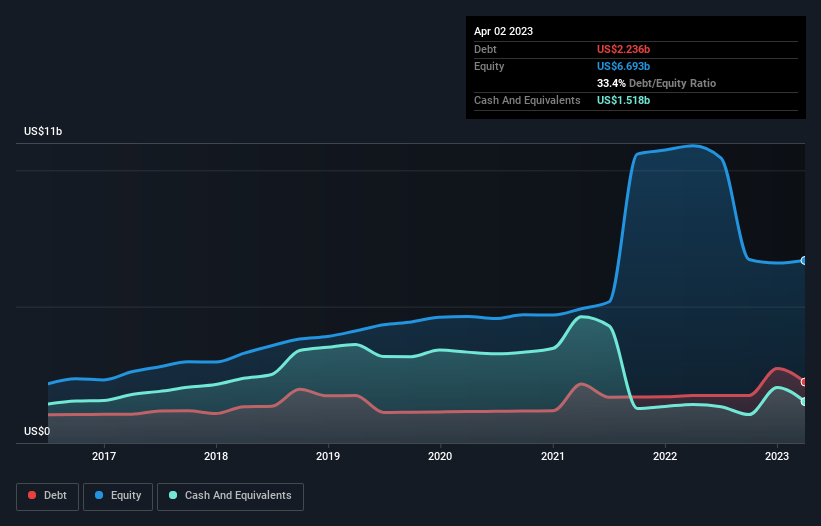
The image below, which you can click on for greater detail, shows that at April 2023 Illumina had debt of US$2.24b, up from US$1.74b in one year. However, it also had US$1.52b in cash, and so its net debt is US$718.0m.
A Look At Illumina's Liabilities
We can see from the most recent balance sheet that Illumina had liabilities of US$2.23b falling due within a year, and liabilities of US$2.89b due beyond that. On the other hand, it had cash of US$1.52b and US$682.0m worth of receivables due within a year. So it has liabilities totalling US$2.92b more than its cash and near-term receivables, combined.
Given Illumina has a humongous market capitalization of US$31.8b, it's hard to believe these liabilities pose much threat. However, we do think it is worth keeping an eye on its balance sheet strength, as it may change over time. The balance sheet is clearly the area to focus on when you are analysing debt. But ultimately the future profitability of the business will decide if Illumina can strengthen its balance sheet over time. So if you want to see what the professionals think, you might find this free report on analyst profit forecasts to be interesting.
In the last year Illumina had a loss before interest and tax, and actually shrunk its revenue by 4.4%, to US$4.4b. That's not what we would hope to see.
Caveat Emptor
Importantly, Illumina had an earnings before interest and tax (EBIT) loss over the last year. Indeed, it lost US$21m at the EBIT level. Considering that alongside the liabilities mentioned above does not give us much confidence that company should be using so much debt. Quite frankly we think the balance sheet is far from match-fit, although it could be improved with time. However, it doesn't help that it burned through US$228m of cash over the last year. So to be blunt we think it is risky. When we look at a riskier company, we like to check how their profits (or losses) are trending over time. Today, we're providing readers this interactive graph showing how Illumina's profit, revenue, and operating cashflow have changed over the last few years.
At the end of the day, it's often better to focus on companies that are free from net debt. You can access our special list of such companies (all with a track record of profit growth). It's free.
Have feedback on this article? Concerned about the content? Get in touch with us directly. Alternatively, email editorial-team (at) simplywallst.com.
This article by Simply Wall St is general in nature. We provide commentary based on historical data and analyst forecasts only using an unbiased methodology and our articles are not intended to be financial advice. It does not constitute a recommendation to buy or sell any stock, and does not take account of your objectives, or your financial situation. We aim to bring you long-term focused analysis driven by fundamental data. Note that our analysis may not factor in the latest price-sensitive company announcements or qualitative material. Simply Wall St has no position in any stocks mentioned.
Join A Paid User Research Session
You’ll receive a US$30 Amazon Gift card for 1 hour of your time while helping us build better investing tools for the individual investors like yourself. Sign up here
