
 Yahoo Finance
 Does IMI plc (LON:IMI) Have A High Beta?

Want to participate in a short research study? Help shape the future of investing tools and you could win a $250 gift card!
Anyone researching IMI plc (LON:IMI) might want to consider the historical volatility of the share price. Modern finance theory considers volatility to be a measure of risk, and there are two main types of price volatility. First, we have company specific volatility, which is the price gyrations of an individual stock. Holding at least 8 stocks can reduce this kind of risk across a portfolio. The second sort is caused by the natural volatility of markets, overall. For example, certain macroeconomic events will impact (virtually) all stocks on the market.
Some stocks see their prices move in concert with the market. Others tend towards stronger, gentler or unrelated price movements. Some investors use beta as a measure of how much a certain stock is impacted by market risk (volatility). While we should keep in mind that Warren Buffett has cautioned that 'Volatility is far from synonymous with risk', beta is still a useful factor to consider. To make good use of it you must first know that the beta of the overall market is one. Any stock with a beta of greater than one is considered more volatile than the market, while those with a beta below one are either less volatile or poorly correlated with the market.
Check out our latest analysis for IMI
What IMI's beta value tells investors
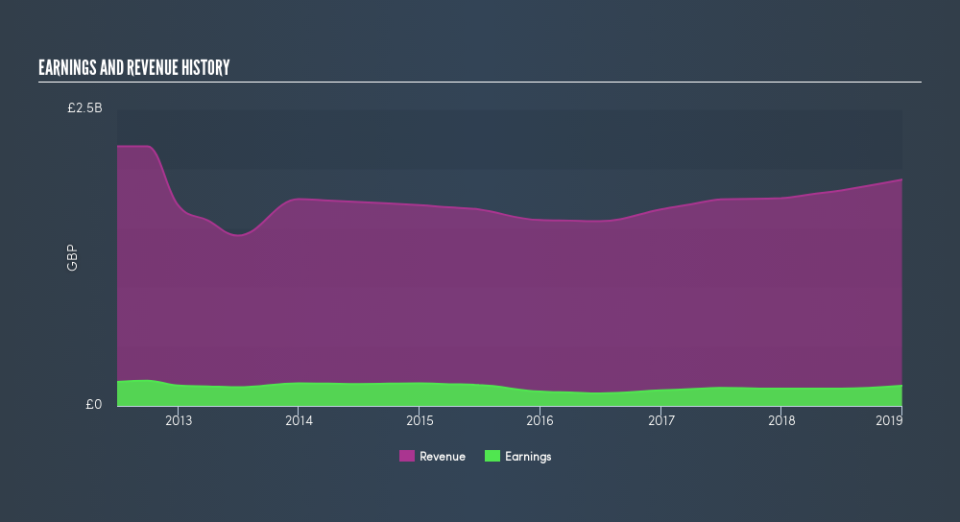
With a beta of 1.03, (which is quite close to 1) the share price of IMI has historically been about as voltile as the broader market. If the future looks like the past, we could therefore consider it likely that the stock price will experience share price volatility that is roughly similar to the overall market. Share price volatility is well worth considering, but most long term investors consider the history of revenue and earnings growth to be more important. Take a look at how IMI fares in that regard, below.
Does IMI's size influence the expected beta?
IMI is a reasonably big company, with a market capitalisation of UK£2.7b. Most companies this size are actively traded with decent volumes of shares changing hands each day. We shouldn't be surprised to see a large company like this with a beta value quite close to the market average. Large companies often move roughly in line with the market. In part, that's because there are fewer individual events that are signficant enough to markedly change the value of the stock (compared to small companies, at least).
What this means for you:
It is probable that there is a link between the share price of IMI and the broader market, since it has a beta value quite close to one. However, long term investors are generally well served by looking past market volatility and focussing on the underlying development of the business. If that's your game, metrics such as revenue, earnings and cash flow will be more useful. This article aims to educate investors about beta values, but it's well worth looking at important company-specific fundamentals such as IMI’s financial health and performance track record. I highly recommend you dive deeper by considering the following:
Future Outlook: What are well-informed industry analysts predicting for IMI’s future growth? Take a look at our free research report of analyst consensus for IMI’s outlook.
Past Track Record: Has IMI been consistently performing well irrespective of the ups and downs in the market? Go into more detail in the past performance analysis and take a look at the free visual representations of IMI's historicals for more clarity.
Other Interesting Stocks: It's worth checking to see how IMI measures up against other companies on valuation. You could start with this free list of prospective options.
We aim to bring you long-term focused research analysis driven by fundamental data. Note that our analysis may not factor in the latest price-sensitive company announcements or qualitative material.
If you spot an error that warrants correction, please contact the editor at editorial-team@simplywallst.com. This article by Simply Wall St is general in nature. It does not constitute a recommendation to buy or sell any stock, and does not take account of your objectives, or your financial situation. Simply Wall St has no position in the stocks mentioned. Thank you for reading.
