
 Yahoo Finance
 Does Inchcape plc's (LON:INCH) CEO Salary Compare Well With Others?

Stefan Bomhard has been the CEO of Inchcape plc (LON:INCH) since 2015. First, this article will compare CEO compensation with compensation at similar sized companies. Then we'll look at a snap shot of the business growth. And finally - as a second measure of performance - we will look at the returns shareholders have received over the last few years. The aim of all this is to consider the appropriateness of CEO pay levels.
View our latest analysis for Inchcape
How Does Stefan Bomhard's Compensation Compare With Similar Sized Companies?
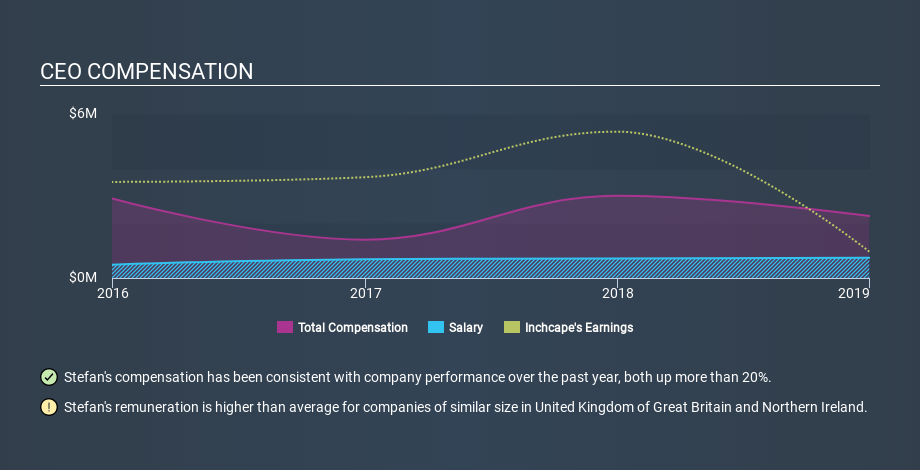
At the time of writing, our data says that Inchcape plc has a market cap of UK£2.6b, and reported total annual CEO compensation of UK£2.3m for the year to December 2018. We think total compensation is more important but we note that the CEO salary is lower, at UK£739k. Importantly, there may be performance hurdles relating to the non-salary component of the total compensation. We examined companies with market caps from UK£1.5b to UK£4.9b, and discovered that the median CEO total compensation of that group was UK£1.7m.
As you can see, Stefan Bomhard is paid more than the median CEO pay at companies of a similar size, in the same market. However, this does not necessarily mean Inchcape plc is paying too much. We can better assess whether the pay is overly generous by looking into the underlying business performance.
The graphic below shows how CEO compensation at Inchcape has changed from year to year.
Is Inchcape plc Growing?
Over the last three years Inchcape plc has shrunk its earnings per share by an average of 25% per year (measured with a line of best fit). It achieved revenue growth of 2.9% over the last year.
Sadly for shareholders, earnings per share are actually down, over three years. And the modest revenue growth over 12 months isn't much comfort against the reduced earnings per share. These factors suggest that the business performance wouldn't really justify a high pay packet for the CEO. You might want to check this free visual report on analyst forecasts for future earnings.
Has Inchcape plc Been A Good Investment?
Inchcape plc has generated a total shareholder return of 23% over three years, so most shareholders would be reasonably content. But they probably wouldn't be so happy as to think the CEO should be paid more than is normal, for companies around this size.
In Summary...
We compared total CEO remuneration at Inchcape plc with the amount paid at companies with a similar market capitalization. As discussed above, we discovered that the company pays more than the median of that group.
We think many shareholders would be underwhelmed with the business growth over the last three years. While shareholder returns are acceptable, they don't delight. So you may want to delve deeper, because we don't think the CEO pay is too low. If you think CEO compensation levels are interesting you will probably really like this free visualization of insider trading at Inchcape.
Arguably, business quality is much more important than CEO compensation levels. So check out this free list of interesting companies, that have HIGH return on equity and low debt.
If you spot an error that warrants correction, please contact the editor at editorial-team@simplywallst.com. This article by Simply Wall St is general in nature. It does not constitute a recommendation to buy or sell any stock, and does not take account of your objectives, or your financial situation. Simply Wall St has no position in the stocks mentioned.
We aim to bring you long-term focused research analysis driven by fundamental data. Note that our analysis may not factor in the latest price-sensitive company announcements or qualitative material. Thank you for reading.
