
 Yahoo Finance
 Does Innodata (NASDAQ:INOD) Have The Makings Of A Multi-Bagger?
To find a multi-bagger stock, what are the underlying trends we should look for in a business? Ideally, a business will show two trends; firstly a growing return on capital employed (ROCE) and secondly, an increasing amount of capital employed. Ultimately, this demonstrates that it's a business that is reinvesting profits at increasing rates of return. With that in mind, we've noticed some promising trends at Innodata (NASDAQ:INOD) so let's look a bit deeper.
Understanding Return On Capital Employed (ROCE)
Just to clarify if you're unsure, ROCE is a metric for evaluating how much pre-tax income (in percentage terms) a company earns on the capital invested in its business. Analysts use this formula to calculate it for Innodata:
Return on Capital Employed = Earnings Before Interest and Tax (EBIT) ÷ (Total Assets - Current Liabilities)
0.044 = US$1.5m ÷ (US$54m - US$19m) (Based on the trailing twelve months to September 2020).
Thus, Innodata has an ROCE of 4.4%. In absolute terms, that's a low return and it also under-performs the IT industry average of 9.4%.
See our latest analysis for Innodata
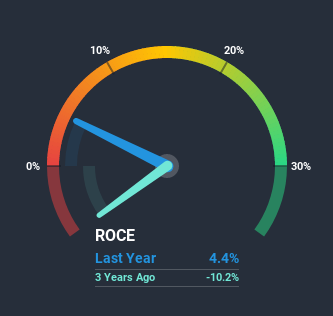
Historical performance is a great place to start when researching a stock so above you can see the gauge for Innodata's ROCE against it's prior returns. If you'd like to look at how Innodata has performed in the past in other metrics, you can view this free graph of past earnings, revenue and cash flow.
What Can We Tell From Innodata's ROCE Trend?
We're delighted to see that Innodata is reaping rewards from its investments and has now broken into profitability. The company was generating losses five years ago, but has managed to turn it around and as we saw earlier is now earning 4.4%, which is always encouraging. Interestingly, the capital employed by the business has remained relatively flat, so these higher returns are either from prior investments paying off or increased efficiencies. So while we're happy that the business is more efficient, just keep in mind that could mean that going forward the business is lacking areas to invest internally for growth. So if you're looking for high growth, you'll want to see a business's capital employed also increasing.
On a side note, we noticed that the improvement in ROCE appears to be partly fueled by an increase in current liabilities. The current liabilities has increased to 36% of total assets, so the business is now more funded by the likes of its suppliers or short-term creditors. Keep an eye out for future increases because when the ratio of current liabilities to total assets gets particularly high, this can introduce some new risks for the business.
The Key Takeaway
As discussed above, Innodata appears to be getting more proficient at generating returns since capital employed has remained flat but earnings (before interest and tax) are up. And a remarkable 128% total return over the last five years tells us that investors are expecting more good things to come in the future. In light of that, we think it's worth looking further into this stock because if Innodata can keep these trends up, it could have a bright future ahead.
If you want to continue researching Innodata, you might be interested to know about the 2 warning signs that our analysis has discovered.
While Innodata isn't earning the highest return, check out this free list of companies that are earning high returns on equity with solid balance sheets.
This article by Simply Wall St is general in nature. It does not constitute a recommendation to buy or sell any stock, and does not take account of your objectives, or your financial situation. We aim to bring you long-term focused analysis driven by fundamental data. Note that our analysis may not factor in the latest price-sensitive company announcements or qualitative material. Simply Wall St has no position in any stocks mentioned.
Have feedback on this article? Concerned about the content? Get in touch with us directly. Alternatively, email editorial-team (at) simplywallst.com.
