
 Yahoo Finance
 How Does Interface's (NASDAQ:TILE) P/E Compare To Its Industry, After Its Big Share Price Gain?

Interface (NASDAQ:TILE) shareholders are no doubt pleased to see that the share price has bounced 45% in the last month alone, although it is still down 45% over the last quarter. But shareholders may not all be feeling jubilant, since the share price is still down 47% in the last year.
Assuming no other changes, a sharply higher share price makes a stock less attractive to potential buyers. While the market sentiment towards a stock is very changeable, in the long run, the share price will tend to move in the same direction as earnings per share. So some would prefer to hold off buying when there is a lot of optimism towards a stock. One way to gauge market expectations of a stock is to look at its Price to Earnings Ratio (PE Ratio). A high P/E ratio means that investors have a high expectation about future growth, while a low P/E ratio means they have low expectations about future growth.
Check out our latest analysis for Interface
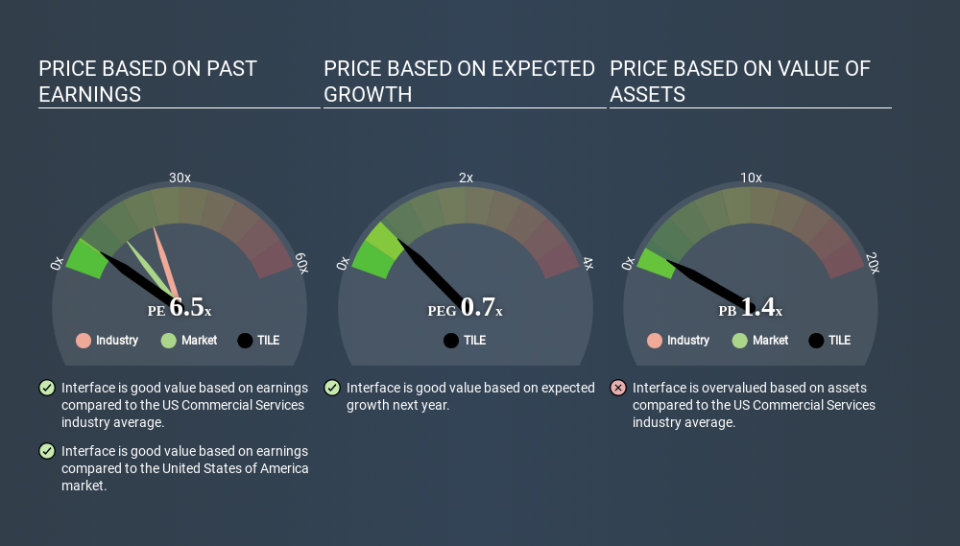
Does Interface Have A Relatively High Or Low P/E For Its Industry?
Interface's P/E of 6.55 indicates relatively low sentiment towards the stock. We can see in the image below that the average P/E (22.4) for companies in the commercial services industry is higher than Interface's P/E.
Interface's P/E tells us that market participants think it will not fare as well as its peers in the same industry. Since the market seems unimpressed with Interface, it's quite possible it could surprise on the upside. You should delve deeper. I like to check if company insiders have been buying or selling.
How Growth Rates Impact P/E Ratios
Generally speaking the rate of earnings growth has a profound impact on a company's P/E multiple. Earnings growth means that in the future the 'E' will be higher. And in that case, the P/E ratio itself will drop rather quickly. A lower P/E should indicate the stock is cheap relative to others -- and that may attract buyers.
Interface's 59% EPS improvement over the last year was like bamboo growth after rain; rapid and impressive. The sweetener is that the annual five year growth rate of 29% is also impressive. So I'd be surprised if the P/E ratio was not above average.
A Limitation: P/E Ratios Ignore Debt and Cash In The Bank
Don't forget that the P/E ratio considers market capitalization. That means it doesn't take debt or cash into account. Hypothetically, a company could reduce its future P/E ratio by spending its cash (or taking on debt) to achieve higher earnings.
Such spending might be good or bad, overall, but the key point here is that you need to look at debt to understand the P/E ratio in context.
So What Does Interface's Balance Sheet Tell Us?
Interface has net debt worth a very significant 101% of its market capitalization. This level of debt justifies a relatively low P/E, so remain cognizant of the debt, if you're comparing it to other stocks.
The Bottom Line On Interface's P/E Ratio
Interface's P/E is 6.5 which is below average (13.6) in the US market. While the EPS growth last year was strong, the significant debt levels reduce the number of options available to management. If it continues to grow, then the current low P/E may prove to be unjustified. What we know for sure is that investors are becoming less uncomfortable about Interface's prospects, since they have pushed its P/E ratio from 4.5 to 6.5 over the last month. If you like to buy stocks that could be turnaround opportunities, then this one might be a candidate; but if you're more sensitive to price, then you may feel the opportunity has passed.
Investors should be looking to buy stocks that the market is wrong about. If the reality for a company is not as bad as the P/E ratio indicates, then the share price should increase as the market realizes this. So this free report on the analyst consensus forecasts could help you make a master move on this stock.
But note: Interface may not be the best stock to buy. So take a peek at this free list of interesting companies with strong recent earnings growth (and a P/E ratio below 20).
If you spot an error that warrants correction, please contact the editor at editorial-team@simplywallst.com. This article by Simply Wall St is general in nature. It does not constitute a recommendation to buy or sell any stock, and does not take account of your objectives, or your financial situation. Simply Wall St has no position in the stocks mentioned.
We aim to bring you long-term focused research analysis driven by fundamental data. Note that our analysis may not factor in the latest price-sensitive company announcements or qualitative material. Thank you for reading.
