
 Yahoo Finance
 How Does Intertek Group plc (LON:ITRK) Fare As A Dividend Stock?

Is Intertek Group plc (LON:ITRK) a good dividend stock? How can we tell? Dividend paying companies with growing earnings can be highly rewarding in the long term. Unfortunately, it's common for investors to be enticed in by the seemingly attractive yield, and lose money when the company has to cut its dividend payments.
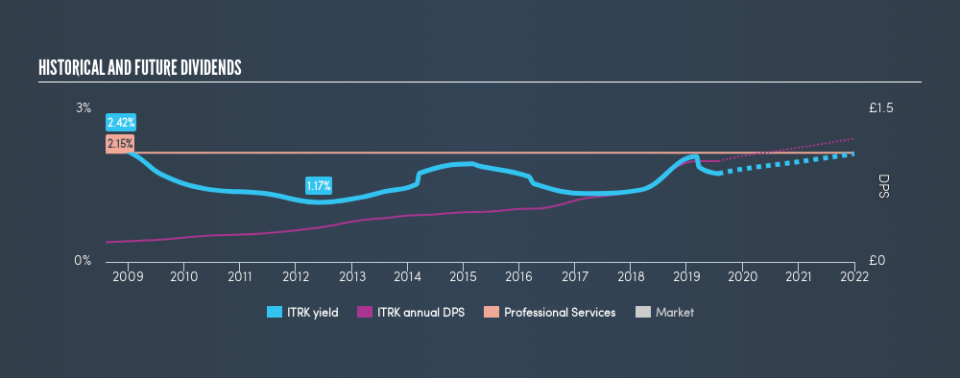
A slim 1.7% yield is hard to get excited about, but the long payment history is respectable. At the right price, or with strong growth opportunities, Intertek Group could have potential. When buying stocks for their dividends, you should always run through the checks below, to see if the dividend looks sustainable.
Explore this interactive chart for our latest analysis on Intertek Group!
Payout ratios
Dividends are typically paid from company earnings. If a company pays more in dividends than it earned, then the dividend might become unsustainable - hardly an ideal situation. Comparing dividend payments to a company's net profit after tax is a simple way of reality-checking whether a dividend is sustainable. Intertek Group paid out 56% of its profit as dividends, over the trailing twelve month period. This is a healthy payout ratio, and while it does limit the amount of earnings that can be reinvested in the business, there is also some room to lift the payout ratio over time.
Another important check we do is to see if the free cash flow generated is sufficient to pay the dividend. Intertek Group's cash payout ratio in the last year was 37%, which suggests dividends were well covered by cash generated by the business. It's positive to see that Intertek Group's dividend is covered by both profits and cash flow, since this is generally a sign that the dividend is sustainable, and a lower payout ratio usually suggests a greater margin of safety before the dividend gets cut.
We update our data on Intertek Group every 24 hours, so you can always get our latest analysis of its financial health, here.
Dividend Volatility
Before buying a stock for its income, we want to see if the dividends have been stable in the past, and if the company has a track record of maintaining its dividend. For the purpose of this article, we only scrutinise the last decade of Intertek Group's dividend payments. During this period the dividend has been stable, which could imply the business could have relatively consistent earnings power. During the past ten-year period, the first annual payment was UK£0.19 in 2009, compared to UK£0.99 last year. Dividends per share have grown at approximately 18% per year over this time.
Dividends have been growing pretty quickly, and even more impressively, they haven't experienced any notable falls during this period.
Dividend Growth Potential
Dividend payments have been consistent over the past few years, but we should always check if earnings per share (EPS) are growing, as this will help maintain the purchasing power of the dividend. Earnings have grown at around 7.3% a year for the past five years, which is better than seeing them shrink! The rate at which earnings have grown is quite decent, and by paying out more than half of its earnings as dividends, the company is striking a reasonable balance between reinvestment and returns to shareholders.
Conclusion
When we look at a dividend stock, we need to form a judgement on whether the dividend will grow, if the company is able to maintain it in a wide range of economic circumstances, and if the dividend payout is sustainable. Intertek Group's payout ratios are within a normal range for the average corporation, and we like that its cashflow was stronger than reported profits. Second, it has a limited history of earnings per share growth, but at least the dividends have been relatively stable. Overall we think Intertek Group is an interesting dividend stock, although it could be better.
Companies that are growing earnings tend to be the best dividend stocks over the long term. See what the 16 analysts we track are forecasting for Intertek Group for free with public analyst estimates for the company.
We have also put together a list of global stocks with a market capitalisation above $1bn and yielding more 3%.
We aim to bring you long-term focused research analysis driven by fundamental data. Note that our analysis may not factor in the latest price-sensitive company announcements or qualitative material.
If you spot an error that warrants correction, please contact the editor at editorial-team@simplywallst.com. This article by Simply Wall St is general in nature. It does not constitute a recommendation to buy or sell any stock, and does not take account of your objectives, or your financial situation. Simply Wall St has no position in the stocks mentioned. Thank you for reading.
