
 Yahoo Finance
 What Does Intrexon Corporation's (NASDAQ:XON) Balance Sheet Tell Us About It?

Want to participate in a short research study? Help shape the future of investing tools and you could win a $250 gift card!
Intrexon Corporation (NASDAQ:XON) is a small-cap stock with a market capitalization of US$1.2b. While investors primarily focus on the growth potential and competitive landscape of the small-cap companies, they end up ignoring a key aspect, which could be the biggest threat to its existence: its financial health. Why is it important? Since XON is loss-making right now, it’s vital to assess the current state of its operations and pathway to profitability. We'll look at some basic checks that can form a snapshot the company’s financial strength. Nevertheless, potential investors would need to take a closer look, and I’d encourage you to dig deeper yourself into XON here.
Does XON Produce Much Cash Relative To Its Debt?
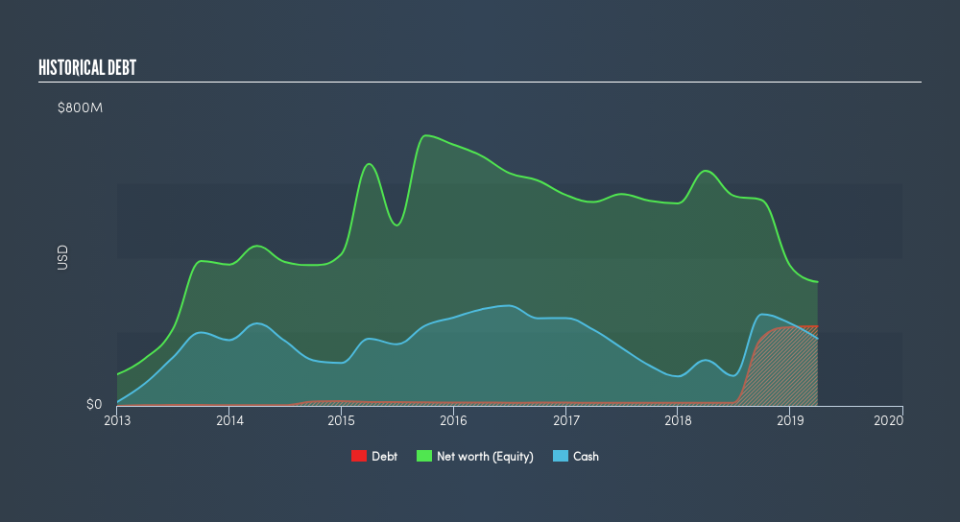
Over the past year, XON has ramped up its debt from US$8.2m to US$260m – this includes long-term debt. With this growth in debt, XON currently has US$182m remaining in cash and short-term investments to keep the business going. Moving on, operating cash flow was negative over the last twelve months. For this article’s sake, I won’t be looking at this today, but you can take a look at some of XON’s operating efficiency ratios such as ROA here.
Can XON pay its short-term liabilities?
With current liabilities at US$59m, the company has been able to meet these commitments with a current assets level of US$232m, leading to a 3.91x current account ratio. The current ratio is calculated by dividing current assets by current liabilities. However, many consider a ratio above 3x to be high.
Does XON face the risk of succumbing to its debt-load?
With debt reaching 64% of equity, XON may be thought of as relatively highly levered. This is somewhat unusual for small-caps companies, since lenders are often hesitant to provide attractive interest rates to less-established businesses. But since XON is presently unprofitable, sustainability of its current state of operations becomes a concern. Maintaining a high level of debt, while revenues are still below costs, can be dangerous as liquidity tends to dry up in unexpected downturns.
Next Steps:
Although XON’s debt level is towards the higher end of the spectrum, its cash flow coverage seems adequate to meet obligations which means its debt is being efficiently utilised. Since there is also no concerns around XON's liquidity needs, this may be its optimal capital structure for the time being. Keep in mind I haven't considered other factors such as how XON has been performing in the past. I recommend you continue to research Intrexon to get a more holistic view of the small-cap by looking at:
Future Outlook: What are well-informed industry analysts predicting for XON’s future growth? Take a look at our free research report of analyst consensus for XON’s outlook.
Historical Performance: What has XON's returns been like over the past? Go into more detail in the past track record analysis and take a look at the free visual representations of our analysis for more clarity.
Other High-Performing Stocks: Are there other stocks that provide better prospects with proven track records? Explore our free list of these great stocks here.
We aim to bring you long-term focused research analysis driven by fundamental data. Note that our analysis may not factor in the latest price-sensitive company announcements or qualitative material.
If you spot an error that warrants correction, please contact the editor at editorial-team@simplywallst.com. This article by Simply Wall St is general in nature. It does not constitute a recommendation to buy or sell any stock, and does not take account of your objectives, or your financial situation. Simply Wall St has no position in the stocks mentioned. Thank you for reading.
