
 Yahoo Finance
 How Does Investing In Ambertech Limited (ASX:AMO) Impact The Volatility Of Your Portfolio?

Anyone researching Ambertech Limited (ASX:AMO) might want to consider the historical volatility of the share price. Modern finance theory considers volatility to be a measure of risk, and there are two main types of price volatility. First, we have company specific volatility, which is the price gyrations of an individual stock. Holding at least 8 stocks can reduce this kind of risk across a portfolio. The second sort is caused by the natural volatility of markets, overall. For example, certain macroeconomic events will impact (virtually) all stocks on the market.
Some stocks mimic the volatility of the market quite closely, while others demonstrate muted, exagerrated or uncorrelated price movements. Beta can be a useful tool to understand how much a stock is influenced by market risk (volatility). However, Warren Buffett said ‘volatility is far from synonymous with risk’ in his 2014 letter to investors. So, while useful, beta is not the only metric to consider. To use beta as an investor, you must first understand that the overall market has a beta of one. A stock with a beta greater than one is more sensitive to broader market movements than a stock with a beta of less than one.
Check out our latest analysis for Ambertech
Want to help shape the future of investing tools and platforms? Take the survey and be part of one of the most advanced studies of stock market investors to date.
What we can learn from AMO’s beta value
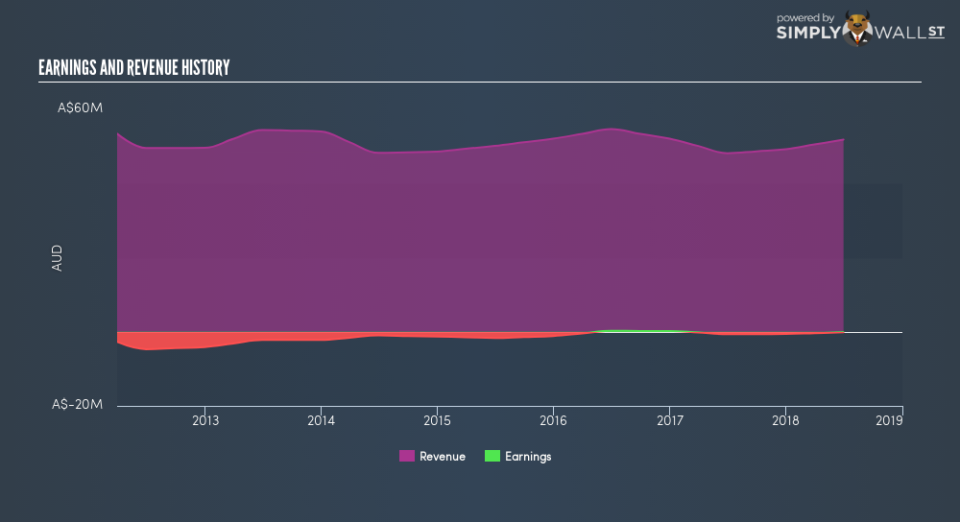
As it happens, Ambertech has a five year beta of 0.92. This is fairly close to 1, so the stock has historically shown a somewhat similar level of volatility as the market. Using history as a guide, we might surmise that the share price is likely to be influenced by market voltility going forward but it probably won’t be particularly sensitive to it. Many would argue that beta is useful in position sizing, but fundamental metrics such as revenue and earnings are more important overall. You can see Ambertech’s revenue and earnings in the image below.
Could AMO’s size cause it to be more volatile?
Ambertech is a noticeably small company, with a market capitalisation of AU$4.4m. Most companies this size are not always actively traded. Companies this small are usually more volatile than the market, whether or not that volatility is correlated. Therefore, it’s a bit surprising to see that this stock has a beta value so close to the overall market.
What this means for you:
It is probable that there is a link between the share price of Ambertech and the broader market, since it has a beta value quite close to one. However, long term investors are generally well served by looking past market volatility and focussing on the underlying development of the business. If that’s your game, metrics such as revenue, earnings and cash flow will be more useful. In order to fully understand whether AMO is a good investment for you, we also need to consider important company-specific fundamentals such as Ambertech’s financial health and performance track record. I highly recommend you dive deeper by considering the following:
Financial Health: Are AMO’s operations financially sustainable? Balance sheets can be hard to analyze, which is why we’ve done it for you. Check out our financial health checks here.
Past Track Record: Has AMO been consistently performing well irrespective of the ups and downs in the market? Go into more detail in the past performance analysis and take a look at the free visual representations of AMO’s historicals for more clarity.
Other High-Performing Stocks: Are there other stocks that provide better prospects with proven track records? Explore our free list of these great stocks here.
To help readers see past the short term volatility of the financial market, we aim to bring you a long-term focused research analysis purely driven by fundamental data. Note that our analysis does not factor in the latest price-sensitive company announcements.
The author is an independent contributor and at the time of publication had no position in the stocks mentioned. For errors that warrant correction please contact the editor at editorial-team@simplywallst.com.
