
 Yahoo Finance
 How Does Investing In Top Image Systems Ltd (NASDAQ:TISA) Impact Your Portfolio?

If you own shares in Top Image Systems Ltd (NASDAQ:TISA) then it’s worth thinking about how it contributes to the volatility of your portfolio, overall. In finance, Beta is a measure of volatility. Volatility is considered to be a measure of risk in modern finance theory. Investors may think of volatility as falling into two main categories. First, we have company specific volatility, which is the price gyrations of an individual stock. Holding at least 8 stocks can reduce this kind of risk across a portfolio. The second type is the broader market volatility, which you cannot diversify away, since it arises from macroeconomic factors which directly affects all the stocks on the market.
Some stocks are more sensitive to general market forces than others. Beta can be a useful tool to understand how much a stock is influenced by market risk (volatility). However, Warren Buffett said ‘volatility is far from synonymous with risk’ in his 2014 letter to investors. So, while useful, beta is not the only metric to consider. To use beta as an investor, you must first understand that the overall market has a beta of one. A stock with a beta greater than one is more sensitive to broader market movements than a stock with a beta of less than one.
See our latest analysis for Top Image Systems
What does TISA’s beta value mean to investors?
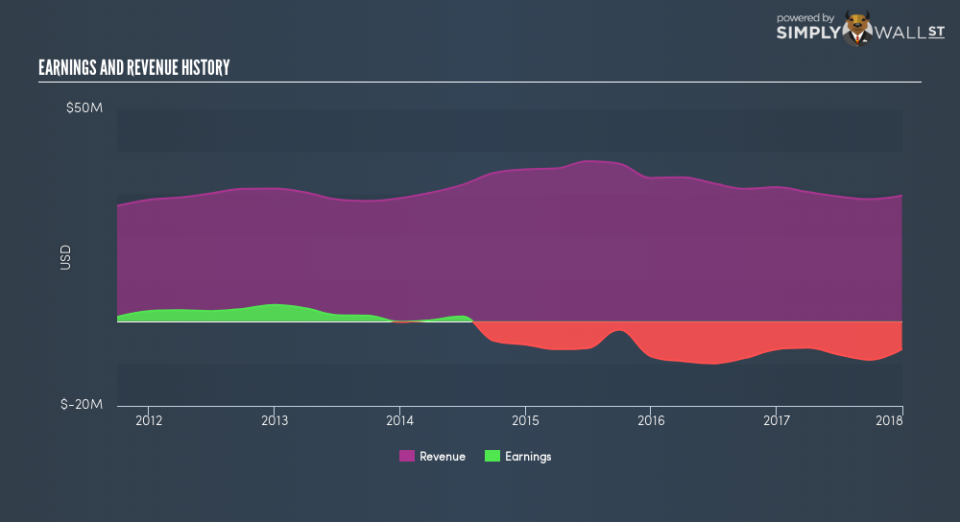
As it happens, Top Image Systems has a five year beta of 0.98. This is fairly close to 1, so the stock has historically shown a somewhat similar level of volatility as the market. While history does not always repeat, this may indicate that the stock price will continue to be exposed to market risk, albeit not overly so. Many would argue that beta is useful in position sizing, but fundamental metrics such as revenue and earnings are more important overall. You can see Top Image Systems’s revenue and earnings in the image below.
Could TISA’s size cause it to be more volatile?
Top Image Systems is a rather small company. It has a market capitalisation of US$17.6m, which means it is probably under the radar of most investors. It doesn’t take much money to really move the share price of a company as small as this one. That makes it somewhat unusual that it has a beta value so close to the overall market.
What this means for you:
Since Top Image Systems has a beta close to one, it will probably show a positive return when the market is moving up, based on history. If you’re trying to generate better returns than the market, it would be worth thinking about other metrics such as cashflows, dividends and revenue growth might be a more useful guide to the future. This article aims to educate investors about beta values, but it’s well worth looking at important company-specific fundamentals such as Top Image Systems’s financial health and performance track record. I highly recommend you dive deeper by considering the following:
Financial Health: Are TISA’s operations financially sustainable? Balance sheets can be hard to analyze, which is why we’ve done it for you. Check out our financial health checks here.
Past Track Record: Has TISA been consistently performing well irrespective of the ups and downs in the market? Go into more detail in the past performance analysis and take a look at the free visual representations of TISA’s historicals for more clarity.
Other High-Performing Stocks: Are there other stocks that provide better prospects with proven track records? Explore our free list of these great stocks here.
To help readers see past the short term volatility of the financial market, we aim to bring you a long-term focused research analysis purely driven by fundamental data. Note that our analysis does not factor in the latest price-sensitive company announcements.
The author is an independent contributor and at the time of publication had no position in the stocks mentioned. For errors that warrant correction please contact the editor at editorial-team@simplywallst.com.
