
 Yahoo Finance
 Does IPOPEMA Securities Spólka Akcyjna’s (WSE:IPE) 12.85% Earnings Growth Make It An Outperformer?

After looking at IPOPEMA Securities Spólka Akcyjna’s (WSE:IPE) latest earnings announcement (31 December 2017), I found it useful to revisit the company’s performance in the past couple of years and assess this against the most recent figures. As a long-term investor I tend to focus on earnings trend, rather than a single number at one point in time. Also, comparing it against an industry benchmark to understand whether it outperformed, or is simply riding an industry wave, is a crucial aspect. Below is a brief commentary on my key takeaways. View our latest analysis for IPOPEMA Securities Spólka Akcyjna
How IPE fared against its long-term earnings performance and its industry
For the most up-to-date info, I use data from the most recent 12 months, which annualizes the latest 6-month earnings release, or some times, the latest annual report is already the most recent financial data. This method allows me to examine different companies on a more comparable basis, using the latest information. For IPOPEMA Securities Spólka Akcyjna, its latest earnings (trailing twelve month) is ZŁ1.65M, which, in comparison to the previous year’s figure, has moved up by 12.85%. Given that these values are somewhat short-term, I have created an annualized five-year figure for IPOPEMA Securities Spólka Akcyjna’s net income, which stands at ZŁ8.14M This means despite the fact that earnings increased from last year’s level, over the longer term, IPOPEMA Securities Spólka Akcyjna’s earnings have been waning on average.
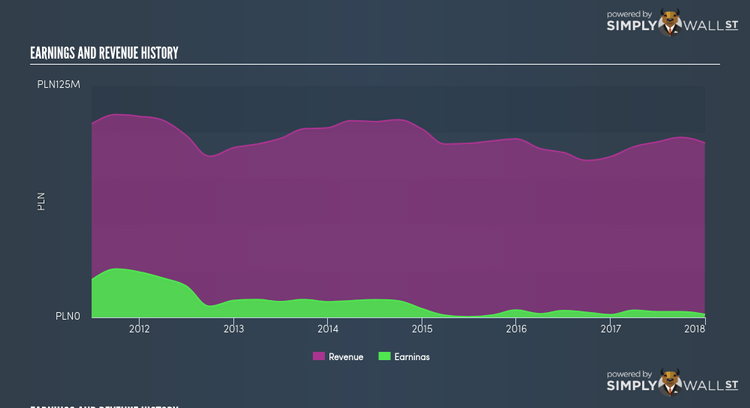
Why could this be happening? Well, let’s take a look at what’s occurring with margins and whether the rest of the industry is feeling the heat. Although revenue growth over the last few years, has been negative, earnings growth has been falling by even more, suggesting that IPOPEMA Securities Spólka Akcyjna has been growing its expenses. This harms margins and earnings, and is not a sustainable practice. Viewing growth from a sector-level, the PL capital markets industry has been growing its average earnings by double-digit 10.30% in the prior year, and a more muted 6.87% over the previous five years. This suggests that whatever uplift the industry is benefiting from, IPOPEMA Securities Spólka Akcyjna is able to leverage this to its advantage.
What does this mean?
IPOPEMA Securities Spólka Akcyjna’s track record can be a valuable insight into its earnings performance, but it certainly doesn’t tell the whole story. Recent positive growth doesn’t necessarily mean it’s onwards and upwards for the company. There may be factors that are affecting the industry as a whole, thus the high industry growth rate over the same period of time. You should continue to research IPOPEMA Securities Spólka Akcyjna to get a better picture of the stock by looking at:
Financial Health: Is IPE’s operations financially sustainable? Balance sheets can be hard to analyze, which is why we’ve done it for you. Check out our financial health checks here.
Other High-Performing Stocks: Are there other stocks that provide better prospects with proven track records? Explore our free list of these great stocks here.
NB: Figures in this article are calculated using data from the trailing twelve months from 31 December 2017. This may not be consistent with full year annual report figures.
To help readers see pass the short term volatility of the financial market, we aim to bring you a long-term focused research analysis purely driven by fundamental data. Note that our analysis does not factor in the latest price sensitive company announcements.
The author is an independent contributor and at the time of publication had no position in the stocks mentioned.
