
 Yahoo Finance
 How Does Joules Group Plc (LON:JOUL) Stand Up To These Simple Dividend Safety Checks?

Could Joules Group Plc (LON:JOUL) be an attractive dividend share to own for the long haul? Investors are often drawn to strong companies with the idea of reinvesting the dividends. Yet sometimes, investors buy a stock for its dividend and lose money because the share price falls by more than they earned in dividend payments.
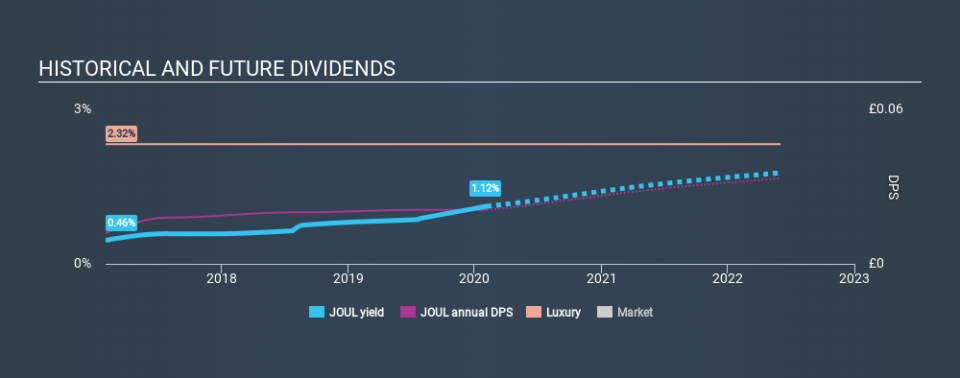
With only a three-year payment history, and a 1.1% yield, investors probably think Joules Group is not much of a dividend stock. While it may not look like much, if earnings are growing it could become quite interesting. The company also returned around 0.7% of its market capitalisation to shareholders in the form of stock buybacks over the past year. Before you buy any stock for its dividend however, you should always remember Warren Buffett's two rules: 1) Don't lose money, and 2) Remember rule #1. We'll run through some checks below to help with this.
Explore this interactive chart for our latest analysis on Joules Group!
Payout ratios
Companies (usually) pay dividends out of their earnings. If a company is paying more than it earns, the dividend might have to be cut. So we need to form a view on if a company's dividend is sustainable, relative to its net profit after tax. Looking at the data, we can see that 47% of Joules Group's profits were paid out as dividends in the last 12 months. A medium payout ratio strikes a good balance between paying dividends, and keeping enough back to invest in the business. Plus, there is room to increase the payout ratio over time.
In addition to comparing dividends against profits, we should inspect whether the company generated enough cash to pay its dividend. Joules Group's cash payout ratio in the last year was 25%, which suggests dividends were well covered by cash generated by the business. It's positive to see that Joules Group's dividend is covered by both profits and cash flow, since this is generally a sign that the dividend is sustainable, and a lower payout ratio usually suggests a greater margin of safety before the dividend gets cut.
While the above analysis focuses on dividends relative to a company's earnings, we do note Joules Group's strong net cash position, which will let it pay larger dividends for a time, should it choose.
Consider getting our latest analysis on Joules Group's financial position here.
Dividend Volatility
Before buying a stock for its income, we want to see if the dividends have been stable in the past, and if the company has a track record of maintaining its dividend. The dividend has not fluctuated much, but with a relatively short payment history, we can't be sure this is sustainable across a full market cycle. During the past three-year period, the first annual payment was UK£0.012 in 2017, compared to UK£0.021 last year. This works out to be a compound annual growth rate (CAGR) of approximately 21% a year over that time.
We're not overly excited about the relatively short history of dividend payments, however the dividend is growing at a nice rate and we might take a closer look.
Dividend Growth Potential
Dividend payments have been consistent over the past few years, but we should always check if earnings per share (EPS) are growing, as this will help maintain the purchasing power of the dividend. Strong earnings per share (EPS) growth might encourage our interest in the company despite fluctuating dividends, which is why it's great to see Joules Group has grown its earnings per share at 27% per annum over the past three years. With high earnings per share growth in recent times and a modest payout ratio, we think this is an attractive combination if earnings can be reinvested to generate further growth.
Conclusion
To summarise, shareholders should always check that Joules Group's dividends are affordable, that its dividend payments are relatively stable, and that it has decent prospects for growing its earnings and dividend. It's great to see that Joules Group is paying out a low percentage of its earnings and cash flow. We were also glad to see it growing earnings, although its dividend history is not as long as we'd like. All things considered, Joules Group looks like a strong prospect. At the right valuation, it could be something special.
Earnings growth generally bodes well for the future value of company dividend payments. See if the 4 Joules Group analysts we track are forecasting continued growth with our free report on analyst estimates for the company.
If you are a dividend investor, you might also want to look at our curated list of dividend stocks yielding above 3%.
If you spot an error that warrants correction, please contact the editor at editorial-team@simplywallst.com. This article by Simply Wall St is general in nature. It does not constitute a recommendation to buy or sell any stock, and does not take account of your objectives, or your financial situation. Simply Wall St has no position in the stocks mentioned.
We aim to bring you long-term focused research analysis driven by fundamental data. Note that our analysis may not factor in the latest price-sensitive company announcements or qualitative material. Thank you for reading.
