
 Yahoo Finance
 Does KEMET (NYSE:KEM) Have A Healthy Balance Sheet?

Some say volatility, rather than debt, is the best way to think about risk as an investor, but Warren Buffett famously said that 'Volatility is far from synonymous with risk. It's only natural to consider a company's balance sheet when you examine how risky it is, since debt is often involved when a business collapses. We note that KEMET Corporation (NYSE:KEM) does have debt on its balance sheet. But should shareholders be worried about its use of debt?
When Is Debt Dangerous?
Debt assists a business until the business has trouble paying it off, either with new capital or with free cash flow. In the worst case scenario, a company can go bankrupt if it cannot pay its creditors. While that is not too common, we often do see indebted companies permanently diluting shareholders because lenders force them to raise capital at a distressed price. Having said that, the most common situation is where a company manages its debt reasonably well - and to its own advantage. The first step when considering a company's debt levels is to consider its cash and debt together.
See our latest analysis for KEMET
What Is KEMET's Debt?
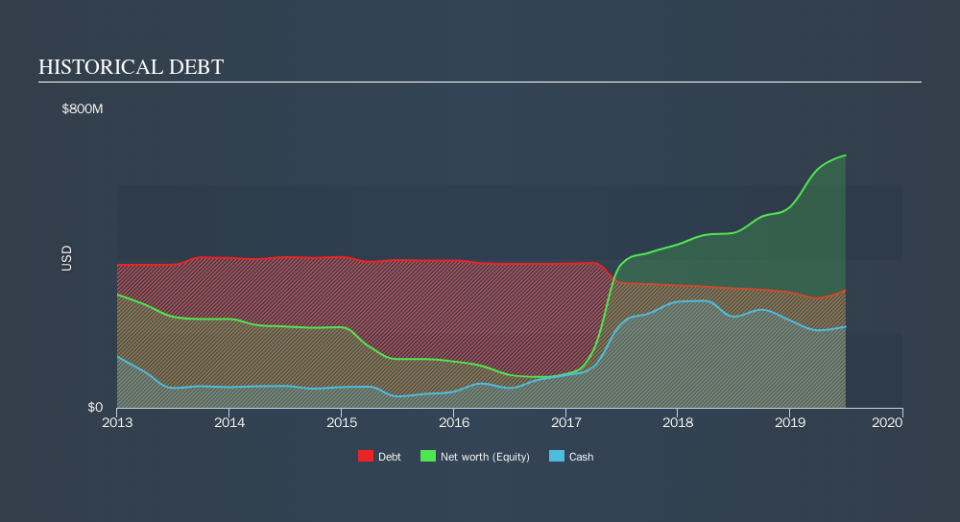
As you can see below, KEMET had US$315.2m of debt, at June 2019, which is about the same the year before. You can click the chart for greater detail. However, it also had US$217.3m in cash, and so its net debt is US$97.9m.
A Look At KEMET's Liabilities
According to the last reported balance sheet, KEMET had liabilities of US$271.1m due within 12 months, and liabilities of US$443.4m due beyond 12 months. On the other hand, it had cash of US$217.3m and US$154.5m worth of receivables due within a year. So its liabilities outweigh the sum of its cash and (near-term) receivables by US$342.6m.
KEMET has a market capitalization of US$1.33b, so it could very likely raise cash to ameliorate its balance sheet, if the need arose. But it's clear that we should definitely closely examine whether it can manage its debt without dilution.
We measure a company's debt load relative to its earnings power by looking at its net debt divided by its earnings before interest, tax, depreciation, and amortization (EBITDA) and by calculating how easily its earnings before interest and tax (EBIT) cover its interest expense (interest cover). This way, we consider both the absolute quantum of the debt, as well as the interest rates paid on it.
KEMET's net debt is only 0.33 times its EBITDA. And its EBIT covers its interest expense a whopping 17.0 times over. So you could argue it is no more threatened by its debt than an elephant is by a mouse. On top of that, KEMET grew its EBIT by 73% over the last twelve months, and that growth will make it easier to handle its debt. When analysing debt levels, the balance sheet is the obvious place to start. But ultimately the future profitability of the business will decide if KEMET can strengthen its balance sheet over time. So if you want to see what the professionals think, you might find this free report on analyst profit forecasts to be interesting.
Finally, a company can only pay off debt with cold hard cash, not accounting profits. So we clearly need to look at whether that EBIT is leading to corresponding free cash flow. In the last three years, KEMET's free cash flow amounted to 20% of its EBIT, less than we'd expect. That weak cash conversion makes it more difficult to handle indebtedness.
Our View
KEMET's interest cover suggests it can handle its debt as easily as Cristiano Ronaldo could score a goal against an under 14's goalkeeper. But truth be told we feel its conversion of EBIT to free cash flow does undermine this impression a bit. Taking all this data into account, it seems to us that KEMET takes a pretty sensible approach to debt. That means they are taking on a bit more risk, in the hope of boosting shareholder returns. We'd be motivated to research the stock further if we found out that KEMET insiders have bought shares recently. If you would too, then you're in luck, since today we're sharing our list of reported insider transactions for free.
At the end of the day, it's often better to focus on companies that are free from net debt. You can access our special list of such companies (all with a track record of profit growth). It's free.
We aim to bring you long-term focused research analysis driven by fundamental data. Note that our analysis may not factor in the latest price-sensitive company announcements or qualitative material.
If you spot an error that warrants correction, please contact the editor at editorial-team@simplywallst.com. This article by Simply Wall St is general in nature. It does not constitute a recommendation to buy or sell any stock, and does not take account of your objectives, or your financial situation. Simply Wall St has no position in the stocks mentioned. Thank you for reading.
