
 Yahoo Finance
 Does Korn Ferry's (NYSE:KFY) P/E Ratio Signal A Buying Opportunity?

Today, we'll introduce the concept of the P/E ratio for those who are learning about investing. We'll show how you can use Korn Ferry's (NYSE:KFY) P/E ratio to inform your assessment of the investment opportunity. What is Korn Ferry's P/E ratio? Well, based on the last twelve months it is 21.27. In other words, at today's prices, investors are paying $21.27 for every $1 in prior year profit.
Check out our latest analysis for Korn Ferry
How Do You Calculate A P/E Ratio?
The formula for price to earnings is:
Price to Earnings Ratio = Price per Share ÷ Earnings per Share (EPS)
Or for Korn Ferry:
P/E of 21.27 = $39.07 ÷ $1.84 (Based on the year to April 2019.)
Is A High P/E Ratio Good?
The higher the P/E ratio, the higher the price tag of a business, relative to its trailing earnings. That isn't a good or a bad thing on its own, but a high P/E means that buyers have a higher opinion of the business's prospects, relative to stocks with a lower P/E.
How Does Korn Ferry's P/E Ratio Compare To Its Peers?
The P/E ratio essentially measures market expectations of a company. The image below shows that Korn Ferry has a P/E ratio that is roughly in line with the professional services industry average (22.6).
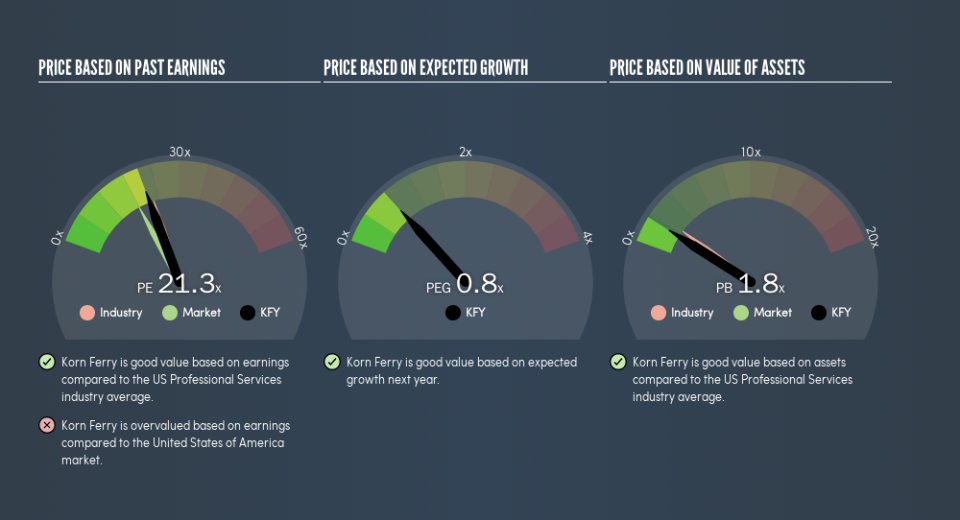
That indicates that the market expects Korn Ferry will perform roughly in line with other companies in its industry. If the company has better than average prospects, then the market might be underestimating it. I would further inform my view by checking insider buying and selling., among other things.
How Growth Rates Impact P/E Ratios
Probably the most important factor in determining what P/E a company trades on is the earnings growth. Earnings growth means that in the future the 'E' will be higher. That means even if the current P/E is high, it will reduce over time if the share price stays flat. And as that P/E ratio drops, the company will look cheap, unless its share price increases.
Korn Ferry's earnings per share fell by 23% in the last twelve months. But over the longer term (5 years) earnings per share have increased by 4.0%.
Remember: P/E Ratios Don't Consider The Balance Sheet
Don't forget that the P/E ratio considers market capitalization. In other words, it does not consider any debt or cash that the company may have on the balance sheet. The exact same company would hypothetically deserve a higher P/E ratio if it had a strong balance sheet, than if it had a weak one with lots of debt, because a cashed up company can spend on growth.
While growth expenditure doesn't always pay off, the point is that it is a good option to have; but one that the P/E ratio ignores.
So What Does Korn Ferry's Balance Sheet Tell Us?
With net cash of US$404m, Korn Ferry has a very strong balance sheet, which may be important for its business. Having said that, at 18% of its market capitalization the cash hoard would contribute towards a higher P/E ratio.
The Verdict On Korn Ferry's P/E Ratio
Korn Ferry has a P/E of 21.3. That's higher than the average in its market, which is 17.8. The recent drop in earnings per share would make some investors cautious, but the relatively strong balance sheet will allow the company time to invest in growth. Clearly, the high P/E indicates shareholders think it will!
Investors should be looking to buy stocks that the market is wrong about. If the reality for a company is better than it expects, you can make money by buying and holding for the long term. So this free visualization of the analyst consensus on future earnings could help you make the right decision about whether to buy, sell, or hold.
Of course, you might find a fantastic investment by looking at a few good candidates. So take a peek at this free list of companies with modest (or no) debt, trading on a P/E below 20.
We aim to bring you long-term focused research analysis driven by fundamental data. Note that our analysis may not factor in the latest price-sensitive company announcements or qualitative material.
If you spot an error that warrants correction, please contact the editor at editorial-team@simplywallst.com. This article by Simply Wall St is general in nature. It does not constitute a recommendation to buy or sell any stock, and does not take account of your objectives, or your financial situation. Simply Wall St has no position in the stocks mentioned. Thank you for reading.
