
 Yahoo Finance
 How Does LendingTree's (NASDAQ:TREE) P/E Compare To Its Industry, After The Share Price Drop?

Unfortunately for some shareholders, the LendingTree (NASDAQ:TREE) share price has dived 40% in the last thirty days. Indeed the recent decline has arguably caused some bitterness for shareholders who have held through the 42% drop over twelve months.
Assuming nothing else has changed, a lower share price makes a stock more attractive to potential buyers. In the long term, share prices tend to follow earnings per share, but in the short term prices bounce around in response to short term factors (which are not always obvious). So, on certain occasions, long term focussed investors try to take advantage of pessimistic expectations to buy shares at a better price. One way to gauge market expectations of a stock is to look at its Price to Earnings Ratio (PE Ratio). Investors have optimistic expectations of companies with higher P/E ratios, compared to companies with lower P/E ratios.
See our latest analysis for LendingTree
Does LendingTree Have A Relatively High Or Low P/E For Its Industry?
We can tell from its P/E ratio of 64.26 that there is some investor optimism about LendingTree. As you can see below, LendingTree has a much higher P/E than the average company (4.4) in the consumer finance industry.
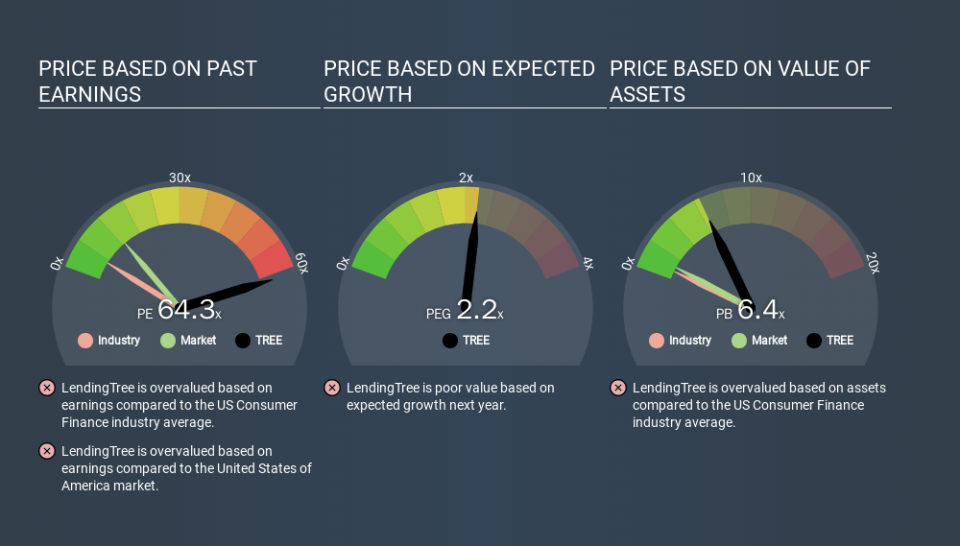
LendingTree's P/E tells us that market participants think the company will perform better than its industry peers, going forward. The market is optimistic about the future, but that doesn't guarantee future growth. So further research is always essential. I often monitor director buying and selling.
How Growth Rates Impact P/E Ratios
P/E ratios primarily reflect market expectations around earnings growth rates. Earnings growth means that in the future the 'E' will be higher. That means even if the current P/E is high, it will reduce over time if the share price stays flat. A lower P/E should indicate the stock is cheap relative to others -- and that may attract buyers.
LendingTree saw earnings per share decrease by 65% last year. But it has grown its earnings per share by 5.2% per year over the last three years.
Remember: P/E Ratios Don't Consider The Balance Sheet
It's important to note that the P/E ratio considers the market capitalization, not the enterprise value. Thus, the metric does not reflect cash or debt held by the company. The exact same company would hypothetically deserve a higher P/E ratio if it had a strong balance sheet, than if it had a weak one with lots of debt, because a cashed up company can spend on growth.
Such spending might be good or bad, overall, but the key point here is that you need to look at debt to understand the P/E ratio in context.
How Does LendingTree's Debt Impact Its P/E Ratio?
LendingTree has net debt worth 11% of its market capitalization. That's enough debt to impact the P/E ratio a little; so keep it in mind if you're comparing it to companies without debt.
The Bottom Line On LendingTree's P/E Ratio
LendingTree's P/E is 64.3 which suggests the market is more focussed on the future opportunity rather than the current level of earnings. With modest debt but no EPS growth in the last year, it's fair to say the P/E implies some optimism about future earnings, from the market. Given LendingTree's P/E ratio has declined from 107.8 to 64.3 in the last month, we know for sure that the market is significantly less confident about the business today, than it was back then. For those who don't like to trade against momentum, that could be a warning sign, but a contrarian investor might want to take a closer look.
When the market is wrong about a stock, it gives savvy investors an opportunity. As value investor Benjamin Graham famously said, 'In the short run, the market is a voting machine but in the long run, it is a weighing machine. So this free visualization of the analyst consensus on future earnings could help you make the right decision about whether to buy, sell, or hold.
But note: LendingTree may not be the best stock to buy. So take a peek at this free list of interesting companies with strong recent earnings growth (and a P/E ratio below 20).
If you spot an error that warrants correction, please contact the editor at editorial-team@simplywallst.com. This article by Simply Wall St is general in nature. It does not constitute a recommendation to buy or sell any stock, and does not take account of your objectives, or your financial situation. Simply Wall St has no position in the stocks mentioned.
We aim to bring you long-term focused research analysis driven by fundamental data. Note that our analysis may not factor in the latest price-sensitive company announcements or qualitative material. Thank you for reading.
