
 Yahoo Finance
 Does Lok’nStore Group Plc’s (LON:LOK) 23% Earnings Growth Reflect The Long-Term Trend?

Want to participate in a short research study? Help shape the future of investing tools and you could win a $250 gift card!
After looking at Lok’nStore Group Plc’s (LON:LOK) latest earnings announcement (31 July 2018), I found it useful to revisit the company’s performance in the past couple of years and assess this against the most recent figures. As a long-term investor I tend to focus on earnings trend, rather than a single number at one point in time. Also, comparing it against an industry benchmark to understand whether it outperformed, or is simply riding an industry wave, is a crucial aspect. Below is a brief commentary on my key takeaways.
See our latest analysis for Lok’nStore Group
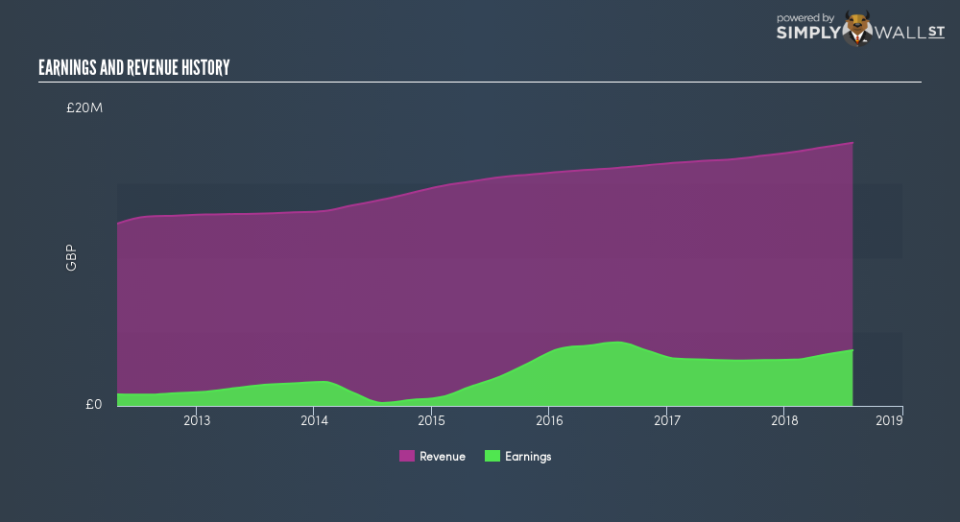
Commentary On LOK’s Past Performance
LOK’s trailing twelve-month earnings (from 31 July 2018) of UK£3.8m has jumped 23% compared to the previous year.
However, this one-year growth rate has been lower than its average earnings growth rate over the past 5 years of 26%, indicating the rate at which LOK is growing has slowed down. Why could this be happening? Well, let’s look at what’s occurring with margins and whether the rest of the industry is experiencing the hit as well.
In terms of returns from investment, Lok’nStore Group has fallen short of achieving a 20% return on equity (ROE), recording 3.6% instead. Furthermore, its return on assets (ROA) of 2.2% is below the GB Real Estate industry of 7.6%, indicating Lok’nStore Group’s are utilized less efficiently. And finally, its return on capital (ROC), which also accounts for Lok’nStore Group’s debt level, has declined over the past 3 years from 3.9% to 3.2%.
What does this mean?
While past data is useful, it doesn’t tell the whole story. Positive growth and profitability are what investors like to see in a company’s track record, but how do we properly assess sustainability? I suggest you continue to research Lok’nStore Group to get a more holistic view of the stock by looking at:
Future Outlook: What are well-informed industry analysts predicting for LOK’s future growth? Take a look at our free research report of analyst consensus for LOK’s outlook.
Financial Health: Are LOK’s operations financially sustainable? Balance sheets can be hard to analyze, which is why we’ve done it for you. Check out our financial health checks here.
Other High-Performing Stocks: Are there other stocks that provide better prospects with proven track records? Explore our free list of these great stocks here.
NB: Figures in this article are calculated using data from the trailing twelve months from 31 July 2018. This may not be consistent with full year annual report figures.
To help readers see past the short term volatility of the financial market, we aim to bring you a long-term focused research analysis purely driven by fundamental data. Note that our analysis does not factor in the latest price-sensitive company announcements.
The author is an independent contributor and at the time of publication had no position in the stocks mentioned. For errors that warrant correction please contact the editor at editorial-team@simplywallst.com.
