
 Yahoo Finance
 How Does Manchester United's (NYSE:MANU) P/E Compare To Its Industry, After The Share Price Drop?

Unfortunately for some shareholders, the Manchester United (NYSE:MANU) share price has dived 34% in the last thirty days. Indeed the recent decline has arguably caused some bitterness for shareholders who have held through the 36% drop over twelve months.
All else being equal, a share price drop should make a stock more attractive to potential investors. While the market sentiment towards a stock is very changeable, in the long run, the share price will tend to move in the same direction as earnings per share. So, on certain occasions, long term focussed investors try to take advantage of pessimistic expectations to buy shares at a better price. One way to gauge market expectations of a stock is to look at its Price to Earnings Ratio (PE Ratio). A high P/E implies that investors have high expectations of what a company can achieve compared to a company with a low P/E ratio.
View our latest analysis for Manchester United
How Does Manchester United's P/E Ratio Compare To Its Peers?
We can tell from its P/E ratio of 78.57 that there is some investor optimism about Manchester United. The image below shows that Manchester United has a significantly higher P/E than the average (16.8) P/E for companies in the entertainment industry.
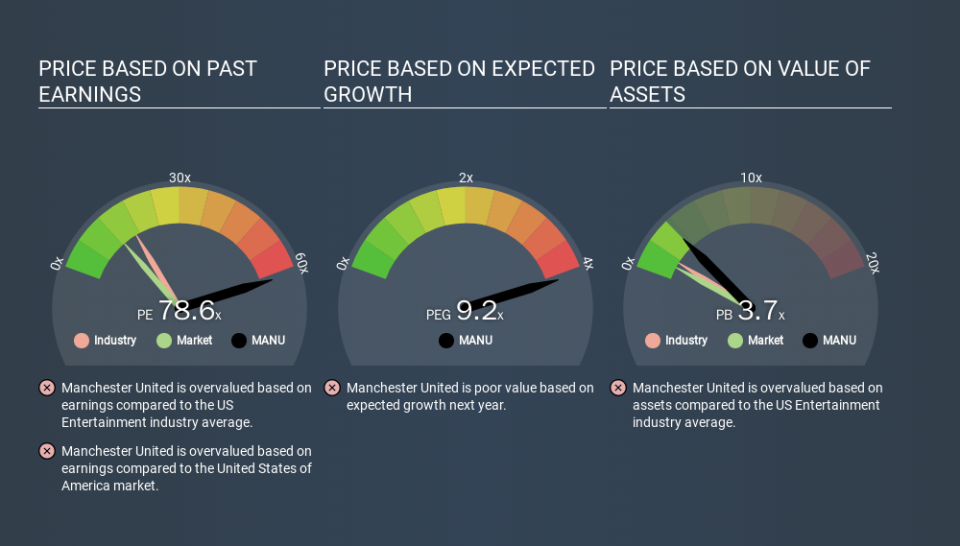
Its relatively high P/E ratio indicates that Manchester United shareholders think it will perform better than other companies in its industry classification. Clearly the market expects growth, but it isn't guaranteed. So investors should always consider the P/E ratio alongside other factors, such as whether company directors have been buying shares.
How Growth Rates Impact P/E Ratios
Companies that shrink earnings per share quickly will rapidly decrease the 'E' in the equation. That means even if the current P/E is low, it will increase over time if the share price stays flat. Then, a higher P/E might scare off shareholders, pushing the share price down.
Manchester United's earnings made like a rocket, taking off 265% last year. Unfortunately, earnings per share are down 12% a year, over 3 years.
Remember: P/E Ratios Don't Consider The Balance Sheet
One drawback of using a P/E ratio is that it considers market capitalization, but not the balance sheet. So it won't reflect the advantage of cash, or disadvantage of debt. The exact same company would hypothetically deserve a higher P/E ratio if it had a strong balance sheet, than if it had a weak one with lots of debt, because a cashed up company can spend on growth.
While growth expenditure doesn't always pay off, the point is that it is a good option to have; but one that the P/E ratio ignores.
Is Debt Impacting Manchester United's P/E?
Net debt totals 23% of Manchester United's market cap. That's enough debt to impact the P/E ratio a little; so keep it in mind if you're comparing it to companies without debt.
The Bottom Line On Manchester United's P/E Ratio
Manchester United's P/E is 78.6 which suggests the market is more focussed on the future opportunity rather than the current level of earnings. While the company does use modest debt, its recent earnings growth is superb. So on this analysis a high P/E ratio seems reasonable. What can be absolutely certain is that the market has become significantly less optimistic about Manchester United over the last month, with the P/E ratio falling from 119.2 back then to 78.6 today. For those who prefer to invest with the flow of momentum, that might be a bad sign, but for a contrarian, it may signal opportunity.
Investors should be looking to buy stocks that the market is wrong about. If the reality for a company is better than it expects, you can make money by buying and holding for the long term. So this free report on the analyst consensus forecasts could help you make a master move on this stock.
Of course you might be able to find a better stock than Manchester United. So you may wish to see this free collection of other companies that have grown earnings strongly.
If you spot an error that warrants correction, please contact the editor at editorial-team@simplywallst.com. This article by Simply Wall St is general in nature. It does not constitute a recommendation to buy or sell any stock, and does not take account of your objectives, or your financial situation. Simply Wall St has no position in the stocks mentioned.
We aim to bring you long-term focused research analysis driven by fundamental data. Note that our analysis may not factor in the latest price-sensitive company announcements or qualitative material. Thank you for reading.
