
 Yahoo Finance
 Does The Market Have A Low Tolerance For FDM Group (Holdings) plc's (LON:FDM) Mixed Fundamentals?
FDM Group (Holdings) (LON:FDM) has had a rough three months with its share price down 23%. It is possible that the markets have ignored the company's differing financials and decided to lean-in to the negative sentiment. Fundamentals usually dictate market outcomes so it makes sense to study the company's financials. Particularly, we will be paying attention to FDM Group (Holdings)'s ROE today.
Return on equity or ROE is an important factor to be considered by a shareholder because it tells them how effectively their capital is being reinvested. In other words, it is a profitability ratio which measures the rate of return on the capital provided by the company's shareholders.
Check out our latest analysis for FDM Group (Holdings)
How Do You Calculate Return On Equity?
The formula for ROE is:
Return on Equity = Net Profit (from continuing operations) ÷ Shareholders' Equity
So, based on the above formula, the ROE for FDM Group (Holdings) is:
53% = UK£41m ÷ UK£77m (Based on the trailing twelve months to December 2023).
The 'return' refers to a company's earnings over the last year. Another way to think of that is that for every £1 worth of equity, the company was able to earn £0.53 in profit.
What Has ROE Got To Do With Earnings Growth?
Thus far, we have learned that ROE measures how efficiently a company is generating its profits. Based on how much of its profits the company chooses to reinvest or "retain", we are then able to evaluate a company's future ability to generate profits. Assuming everything else remains unchanged, the higher the ROE and profit retention, the higher the growth rate of a company compared to companies that don't necessarily bear these characteristics.
FDM Group (Holdings)'s Earnings Growth And 53% ROE
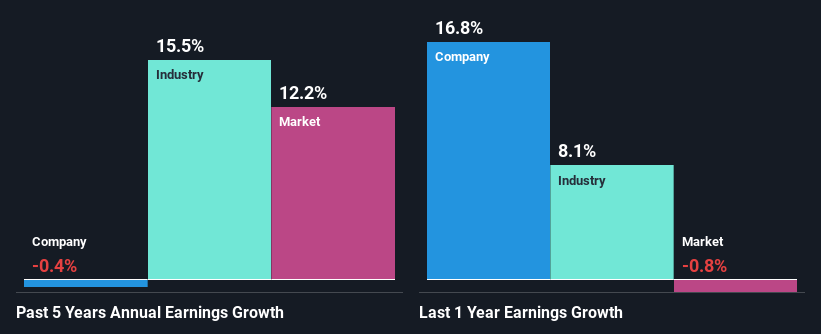
To begin with, FDM Group (Holdings) has a pretty high ROE which is interesting. Additionally, the company's ROE is higher compared to the industry average of 14% which is quite remarkable. Given the circumstances, we can't help but wonder why FDM Group (Holdings) saw little to no growth in the past five years. Based on this, we feel that there might be other reasons which haven't been discussed so far in this article that could be hampering the company's growth. For example, it could be that the company has a high payout ratio or the business has allocated capital poorly, for instance.
We then compared FDM Group (Holdings)'s net income growth with the industry and found that the average industry growth rate was 16% in the same 5-year period.
Earnings growth is a huge factor in stock valuation. It’s important for an investor to know whether the market has priced in the company's expected earnings growth (or decline). This then helps them determine if the stock is placed for a bright or bleak future. What is FDM worth today? The intrinsic value infographic in our free research report helps visualize whether FDM is currently mispriced by the market.
Is FDM Group (Holdings) Using Its Retained Earnings Effectively?
FDM Group (Holdings) has a three-year median payout ratio as high as 114% meaning that the company is paying a dividend which is beyond its means. This does go some way in explaining the negligible earnings growth seen by FDM Group (Holdings). Paying a dividend beyond their means is usually not viable over the long term. That's a huge risk in our books. Our risks dashboard should have the 2 risks we have identified for FDM Group (Holdings).
Moreover, FDM Group (Holdings) has been paying dividends for nine years, which is a considerable amount of time, suggesting that management must have perceived that the shareholders prefer dividends over earnings growth. Our latest analyst data shows that the future payout ratio of the company over the next three years is expected to be approximately 107%. However, FDM Group (Holdings)'s future ROE is expected to decline to 39% despite there being not much change anticipated in the company's payout ratio.
Summary
In total, we're a bit ambivalent about FDM Group (Holdings)'s performance. While the company does have a high rate of return, its low earnings retention is probably what's hampering its earnings growth. Moreover, after studying current analyst estimates, we discovered that the company's earnings are expected to continue to shrink in the future. To know more about the company's future earnings growth forecasts take a look at this free report on analyst forecasts for the company to find out more.
Have feedback on this article? Concerned about the content? Get in touch with us directly. Alternatively, email editorial-team (at) simplywallst.com.
This article by Simply Wall St is general in nature. We provide commentary based on historical data and analyst forecasts only using an unbiased methodology and our articles are not intended to be financial advice. It does not constitute a recommendation to buy or sell any stock, and does not take account of your objectives, or your financial situation. We aim to bring you long-term focused analysis driven by fundamental data. Note that our analysis may not factor in the latest price-sensitive company announcements or qualitative material. Simply Wall St has no position in any stocks mentioned.
