
 Yahoo Finance
 Does The Market Have A Low Tolerance For Griffin Mining Limited's (LON:GFM) Mixed Fundamentals?
Griffin Mining (LON:GFM) has had a rough month with its share price down 13%. It seems that the market might have completely ignored the positive aspects of the company's fundamentals and decided to weigh-in more on the negative aspects. Long-term fundamentals are usually what drive market outcomes, so it's worth paying close attention. In this article, we decided to focus on Griffin Mining's ROE.
Return on Equity or ROE is a test of how effectively a company is growing its value and managing investors’ money. Put another way, it reveals the company's success at turning shareholder investments into profits.
Check out our latest analysis for Griffin Mining
How Do You Calculate Return On Equity?
The formula for ROE is:
Return on Equity = Net Profit (from continuing operations) ÷ Shareholders' Equity
So, based on the above formula, the ROE for Griffin Mining is:
3.8% = US$8.9m ÷ US$234m (Based on the trailing twelve months to December 2020).
The 'return' is the amount earned after tax over the last twelve months. One way to conceptualize this is that for each £1 of shareholders' capital it has, the company made £0.04 in profit.
What Has ROE Got To Do With Earnings Growth?
Thus far, we have learned that ROE measures how efficiently a company is generating its profits. Based on how much of its profits the company chooses to reinvest or "retain", we are then able to evaluate a company's future ability to generate profits. Assuming everything else remains unchanged, the higher the ROE and profit retention, the higher the growth rate of a company compared to companies that don't necessarily bear these characteristics.
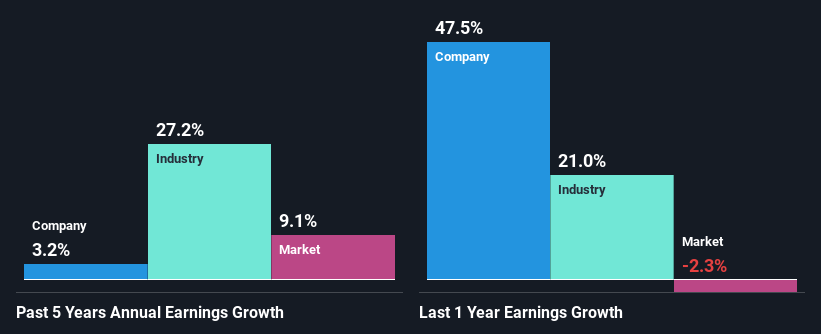
A Side By Side comparison of Griffin Mining's Earnings Growth And 3.8% ROE
When you first look at it, Griffin Mining's ROE doesn't look that attractive. Next, when compared to the average industry ROE of 16%, the company's ROE leaves us feeling even less enthusiastic. Thus, the low net income growth of 3.2% seen by Griffin Mining over the past five years could probably be the result of the low ROE.
We then compared Griffin Mining's net income growth with the industry and found that the company's growth figure is lower than the average industry growth rate of 27% in the same period, which is a bit concerning.
Earnings growth is a huge factor in stock valuation. What investors need to determine next is if the expected earnings growth, or the lack of it, is already built into the share price. This then helps them determine if the stock is placed for a bright or bleak future. Is GFM fairly valued? This infographic on the company's intrinsic value has everything you need to know.
Is Griffin Mining Efficiently Re-investing Its Profits?
Summary
In total, we're a bit ambivalent about Griffin Mining's performance. While the company does have a high rate of profit retention, its low rate of return is probably hampering its earnings growth. That being so, the latest analyst forecasts show that the company will continue to see an expansion in its earnings. Are these analysts expectations based on the broad expectations for the industry, or on the company's fundamentals? Click here to be taken to our analyst's forecasts page for the company.
This article by Simply Wall St is general in nature. It does not constitute a recommendation to buy or sell any stock, and does not take account of your objectives, or your financial situation. We aim to bring you long-term focused analysis driven by fundamental data. Note that our analysis may not factor in the latest price-sensitive company announcements or qualitative material. Simply Wall St has no position in any stocks mentioned.
Have feedback on this article? Concerned about the content? Get in touch with us directly. Alternatively, email editorial-team (at) simplywallst.com.
