
 Yahoo Finance
 Does The Market Have A Low Tolerance For Kier Group plc's (LON:KIE) Mixed Fundamentals?
Kier Group (LON:KIE) has had a rough three months with its share price down 14%. We, however decided to study the company's financials to determine if they have got anything to do with the price decline. Stock prices are usually driven by a company’s financial performance over the long term, and therefore we decided to pay more attention to the company's financial performance. Specifically, we decided to study Kier Group's ROE in this article.
Return on Equity or ROE is a test of how effectively a company is growing its value and managing investors’ money. In short, ROE shows the profit each dollar generates with respect to its shareholder investments.
See our latest analysis for Kier Group
How Is ROE Calculated?
ROE can be calculated by using the formula:
Return on Equity = Net Profit (from continuing operations) ÷ Shareholders' Equity
So, based on the above formula, the ROE for Kier Group is:
5.3% = UK£23m ÷ UK£435m (Based on the trailing twelve months to June 2021).
The 'return' refers to a company's earnings over the last year. Another way to think of that is that for every £1 worth of equity, the company was able to earn £0.05 in profit.
What Has ROE Got To Do With Earnings Growth?
We have already established that ROE serves as an efficient profit-generating gauge for a company's future earnings. We now need to evaluate how much profit the company reinvests or "retains" for future growth which then gives us an idea about the growth potential of the company. Assuming all else is equal, companies that have both a higher return on equity and higher profit retention are usually the ones that have a higher growth rate when compared to companies that don't have the same features.
Kier Group's Earnings Growth And 5.3% ROE
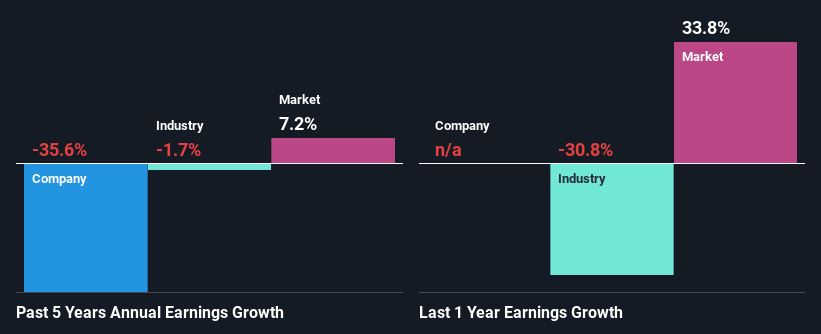
When you first look at it, Kier Group's ROE doesn't look that attractive. However, its ROE is similar to the industry average of 5.3%, so we won't completely dismiss the company. But then again, Kier Group's five year net income shrunk at a rate of 36%. Remember, the company's ROE is a bit low to begin with. Hence, this goes some way in explaining the shrinking earnings.
Furthermore, even when compared to the industry, which has been shrinking its earnings at a rate 1.7% in the same period, we found that Kier Group's performance is pretty disappointing, as it suggests that the company has been shrunk its earnings at a rate faster than the industry.
Earnings growth is an important metric to consider when valuing a stock. It’s important for an investor to know whether the market has priced in the company's expected earnings growth (or decline). This then helps them determine if the stock is placed for a bright or bleak future. Is Kier Group fairly valued compared to other companies? These 3 valuation measures might help you decide.
Is Kier Group Making Efficient Use Of Its Profits?
Kier Group doesn't pay any dividend, meaning that the company is keeping all of its profits, which makes us wonder why it is retaining its earnings if it can't use them to grow its business. So there could be some other explanations in that regard. For instance, the company's business may be deteriorating.
Summary
Overall, we have mixed feelings about Kier Group. Even though it appears to be retaining most of its profits, given the low ROE, investors may not be benefitting from all that reinvestment after all. The low earnings growth suggests our theory correct. Wrapping up, we would proceed with caution with this company and one way of doing that would be to look at the risk profile of the business. You can see the 2 risks we have identified for Kier Group by visiting our risks dashboard for free on our platform here.
This article by Simply Wall St is general in nature. We provide commentary based on historical data and analyst forecasts only using an unbiased methodology and our articles are not intended to be financial advice. It does not constitute a recommendation to buy or sell any stock, and does not take account of your objectives, or your financial situation. We aim to bring you long-term focused analysis driven by fundamental data. Note that our analysis may not factor in the latest price-sensitive company announcements or qualitative material. Simply Wall St has no position in any stocks mentioned.
Have feedback on this article? Concerned about the content? Get in touch with us directly. Alternatively, email editorial-team (at) simplywallst.com.
