
 Yahoo Finance
 How Does This Market Sell-Off Compare to Q4 2018?
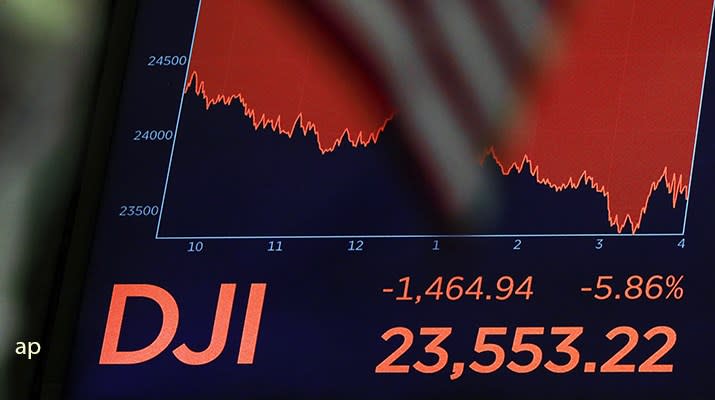
Stock market sell-offs have been few and far between in recent years, but panic about the impact of the coronavirus has caused the FTSE 100 to fall to its lowest level since 2012. The UK and US stock markets are now officially in a “bear market”, generally defined as a 20% fall from a market’s peak.
The last time investors saw a significant sell-off was at the end of 2018, when concerns about the slowdown in the US economy and the ramping up of trade tensions between the US and China caused major market jitters. The US stock market was 20% lower than its September highs by Christmas that year, but had recovered half of the losses by the middle of January.
Here we look at how the Q4 sell-off compares to the market movements of the past three months. We have analysed the performance of the Investment Association fund sectors over the two periods.
Among the UK sectors, the notable difference is that UK Smaller Companies have held up much better this time round. While the average fund in the sector is down 8.34% over the past three months, that is significantly better than the 16.44% average loss in the 2018 sell-off.
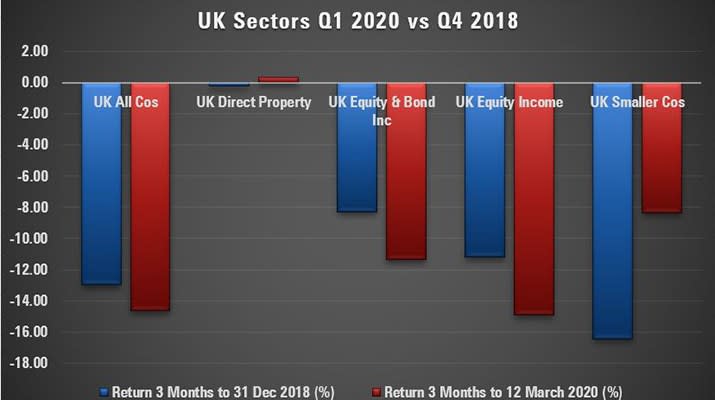
The UK All Companies sector, which has a greater bias towards large-cap companies, has fared slightly worse – down 14.63% over the past three months, compared to a loss just shy of 13% in 2018. The international earnings of big blue-chips could be particularly vulnerable in a pandemic situation because they may not be able to continue trading globally. Ben Yearsley, director at Shore Financial Planning, adds: "Oil has been a huge detractor in the performance of large-cap companies and the fall in the price this week will not have helped."
It’s worth pointing out, of course, that the past three months have included the latter part of December’s Boris Bounce so the fortunes of the various UK sectors could shift as the coronavirus continues to play out.
Among global equity sectors the average loss across all the fund sectors is 8.85% over the past three months, compared to an average loss of 11.25% in the three months to December 31, 2018. There are some nuances within that, however. Japanese Smaller Companies funds have fared worse in the current bout of volatility, down 20.38% over the past three months compared to 15.64% in 2018; Global Emerging Markets funds and Global Equity Income funds have also seen greater falls in the recent volatility.
Interestingly, China funds are the only equity sector to have posted positive returns over the past three months. After heavy losses after the initial announcement of the coronavirus, many investors were reassured by the decisive action taken by the Chinese government, and the country’s stock market has since bounced back.
Yearsley says: "Chinese funds had a fantastic month in February. Many of the healthcare diagnostics and tech companies are poised to do well in the current environment and there is a feeling that the country has the situation under control and its economy will bounce back quickly."
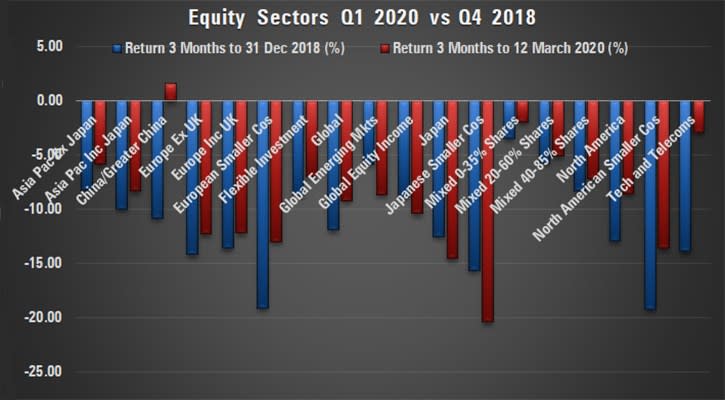
The Technology and Telecoms sector along with US-focused funds endured the heaviest losses in the sell-off of 2018. Investors were fretful about the implications of a trade war between the US and China and many of the tech giants that had enjoyed years of stellar gains endured significant falls at the time.
Over the past three months, however, the Tech and Telecoms sector is down just 2.86%, compared to a 13.87% loss in the 2018 sell-off. North America funds are down 8.57% over the past three months, compared to 12.87% in 2018, and North American Smaller Companies funds are down 13.61% and 19.2% respectively.
Yearsley says: "This situation could actually be very good for tech companies. As more people work from home and schools close, forcing students to learn from, this could spark a shift that really benefits tech businesses."
Fixed Income assets are often seen as a safe haven during times of uncertainty and many of these sectors have indeed held up well both in recent weeks and in the last bout of volatility. UK Gilts funds have been by far the strongest performers, up 7.93% over the past three months compared to a modest rise of 0.16% in 2018. Index-Linked Gilt funds, too, have delivered positive returns for investors – likely helped along by the gains made in December following the UK’s General Election.
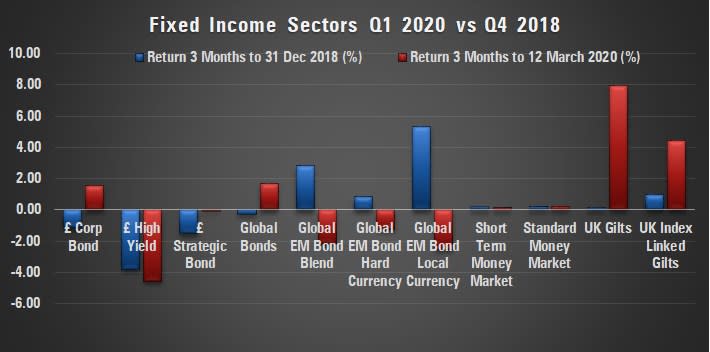
Emerging Market Bond funds had posted positive returns in the 2018 drama but have fallen into negative territory in recent weeks, and High Yield bond funds saw the biggest losses in both periods as investors turn away from risk assets in the flight to safety.
Yearsley says: "Ultimately, there is no comparison in the drivers between today's sell-off and the one in 2018. The current situation has come from two Black Swans - coronavirus and an oil price war - whereas 2018 was driven by concerns over interest rate rises. However, the way investors should react is the same: don't panic - you only make a loss if you sell."
